Blog/Research
A Guide to Data Quality for Online Panel Research in 2022
New status quo
Panel marketplaces now dominate the research industry
Online panel research traditionally involved panels sending out email invites to their own panellists and then waiting for a response. Panel marketplaces, not individual panels, now dominate the industry, supplying all major pollsters. With panel marketplaces, a survey gets distributed to hundreds of panels, each using a variety of methods to recruit panellists for surveys.
What that means for data quality
Value has shifted from owning the audience to data quality
Marketplaces bring great advantages. They reduce biases associated with any individual panel, give access to a more diverse audience, bring greater speed, and global scale. This is great for end users, who can access many audiences more quickly and at lower cost than ever before.
However, all online panel research comes with a risk—fraud and disengagement. Panel marketplaces offer greater scale and thus greater returns for nefarious actors. The actual panels cannot ensure high quality because they do not see all the questions and answers. Marketplaces can spot some bots, but those make up a minority of low-quality respondents.
In reality, online panels all recruit from the same pool, and thus all share the same problems with fraud and disengagement. Some providers claim unique capabilities: people in their panel are more engaged, people are more truthful. However, our analysis reveals that data quality is more an artefact of the individual survey and responses, not the overall panel. More important questions to ask include whether respondents were paying attention this morning or whether they were telling the truth this afternoon when they did the survey. Less important is whether the panel consistently has ‘more honest’ people.
Misaligned incentives in the panel industry
There is a tension between data quality and reducing panel churn
Additionally, panels are incentivised to give the panellist the best experience possible. They want to keep churn low (their biggest problem). The most important factor for panellists is getting paid. However, panels are not incentivised to kick out panellists for anything other than outright fraud or bot-like behaviour, as it directly affects their bottom line.
So, the scale of the data quality problem is huge. Bots and fraudulent panellists change behaviour the whole time. Marketplaces only spot a minority of bad respondents. Traditional agencies are not totally aligned with their customers. Old-school checks are manual and not scalable. Providers that say they have the best panel are ignoring the reality that survey-taker behaviour is highly variable: the only outcome that matters is the project itself.
Data quality innovation
Need to analyse behaviour across multiple surveys
We believe that the best providers will be those that can analyse behaviour across all the surveys and respondents they see to spot issues. They can take respondents from any source to drive more scale, speed and lower cost. Then continually optimise their data quality checks to keep quality as high as possible for every survey. The best providers are those that optimise for the quality of each project, not for panel metrics.
We’ve analysed hundreds of millions of responses that have gone through our system over the past year. We strongly believe that binary rules are imperfect and struggle to generalise across surveys. In other words, quality is contextual. Rules need to share information to accurately identify poor quality respondents effectively.
We’ve summarised a few of our top-line findings from analysing hundreds of millions of responses below.
Our findings
20% of respondents on average should be removed on data quality grounds
Our data shows the number of poor quality respondents is highly correlated with the length of the survey, not the question wording. Respondents are reasonably good at wading through poorly written questions while they hate 20 matrix (grid) questions in a row. A few observations about how poor quality respondents are distributed:
- About 5% of respondents per survey are totally fraudulent and display bot-like behaviour. An additional 15% are disengaged and provide low-quality or inconsistent responses.
- Surveys of 20 minutes or longer see > 40% poor-quality respondents.
- The young are often worse than the old.
- Those using mobiles are worse than respondents using desktop.
Speed is important, but acceleration is more predictive
A blanket speeding threshold for all respondents overlooks the fact that what is “too fast” differs for different types of respondent. Young respondents, respondents completing on mobile, and experienced survey takers all tend to respond faster, but our analysis shows that they are not always bad respondents.
The best speeder check is one that looks at the acceleration of a respondent through a survey. We observe respondents who get considerably quicker throughout the survey tend to be lower quality than those who respond at a consistent pace, even if that pace is quick.
‘Flatlining’ is a blunt check that needs to be used carefully
Flatlining traditionally was a check to capture respondents who give the same response option for all rows in a matrix or grid question. Our data indicates respondents are now aware they will get terminated if they do this and ‘flatline’ in more complex ways, notably diagonals, repetitions, often mixed in with some flatlining.
Flatliner checks should be used in conjunction with speeder checks. You need to know how long respondents took on each question and see whether their responses have any flatliner patterns to assess poor quality.
Inconsistency checks are very effective but operationally intensive
Inconsistency checks are very effective at assessing disengaged or fraudulent respondents. They need to be applied in a practical way: people hold contradictory views, and survey takers are no exception.
We find two types of inconsistency: the impossible and the unlikely.
- “Impossible” inconsistencies can be used safely.
- “Unlikely” inconsistencies should be viewed in the context of all the respondent’s answers to a survey, not applied as a one-off hard check. If a respondent says they intend to vote Green, but that climate change is not something they care about, this doesn’t necessarily make them a bad respondent. Unlikely inconsistencies need to be given more contextual information by speed and previous flatlining behaviour.
Free text questions are the best checks
There are two types of quality checks: subjective checks (those that can be argued indicate low quality) and objective checks (those that indicate definitely bad respondents). Gibberish checks are the best example of the latter, and as such are one of the most powerful checks you can use. So long as the free text question is not asking for overly sensitive information, there is little excuse for a respondent not giving a meaningful answer. We recommend including at least one free text question on all surveys.
Use the profiling information from panels to verify quality
Panels store basic demographic information on respondents. This is an often-untapped resource when it comes to data quality. If a respondent says they are an old man in the survey, but their panel profile says they are a young woman, then this is a red flag. Based on our analysis, 5-10% of all respondents contradict themselves in this way and crucially this is correlated with failing other quality checks. Knowing about, and using, this profiling information for quality assurance is a valuable way to identify poor quality respondents.
Promoting data quality is a two-way street
There are two broad types of low quality respondents:
- fraudulent respondents, who have decided from the outset that they will intentionally complete the survey badly; and
- low-attention (disengaged) respondents, who start the survey with good intentions, but can be lost if the survey feels irrelevant, too long, or too boring.
Fraudulent respondents are lost causes, but the latter may be won over by good survey design. There is a big pay-off if you can keep such respondents engaged. The group skews towards busy, young, mobile users, often completing a survey in a relatively short window. If you lose them from your sample, you will be inadvertently biasing your sample and damaging the reliability of your data.
What Focaldata does about data quality
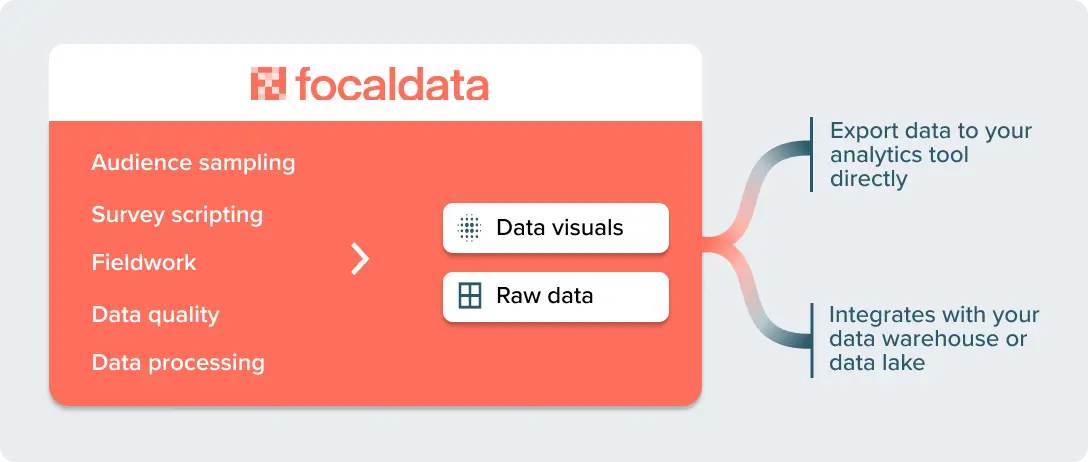
Focaldata is an end-to-end research platform that integrates audience sampling, scripting, fieldwork, data quality and data processing into one system. Our system is unique. We track respondents across the entire project lifecycle, across multiple surveys on multiple topics.
Data quality is at the heart of what we do. We’ve built a machine learning-driven data quality engine that automatically detects and screens out low-quality and fraudulent respondents. This means we can deliver the best of both worlds: unbiased, representative, rapid data from online panels with no compromise on quality.
Building a robust data quality engine requires a detailed, ongoing analysis of fraud and poor quality across hundreds of millions of responses. Traditional, crude checks are not effective, and are liable to do more harm than good. They can inadvertently sweep up good respondents, and can leave you with more skewed and unreliable data as a result. There is more subtlety and nuance involved in capturing bad respondents.
Our automated data quality engine therefore uses a variety of signals and measures to build a detailed picture of how likely it is that a given respondent on a given survey is low quality. We then use this scoring to decide automatically whether or not they should be retained within the sample.