Blog/Polling
US midterm elections 2026: Our final call
This is our final forecast for the 2026 US midterm elections. It brings together around 30,000 interviews from our monthly surveys with the Financial Times, public polling and fundamentals. We start with our projections for the House, the Senate and every race, and how wrong they could be. We then set out what is driving them, and how our model works.
Our final forecast
We give a 99% chance of the Democrats winning the House and a 67% chance of them winning the Senate.
We make a forecast for every single race, and we account for both race-level and national polling errors. We simulate the whole election 50,000 times. In the House, the most likely outcome is 237 Democratic seats (they need 218 to win control), with a 90% range of 225 to 251. In the Senate, the average is 51.5 Democratic seats (exactly 51 is narrowly the most likely individual result). Democrats need 51 because, with a 50-50 split, the VP breaks the tie for Republicans.
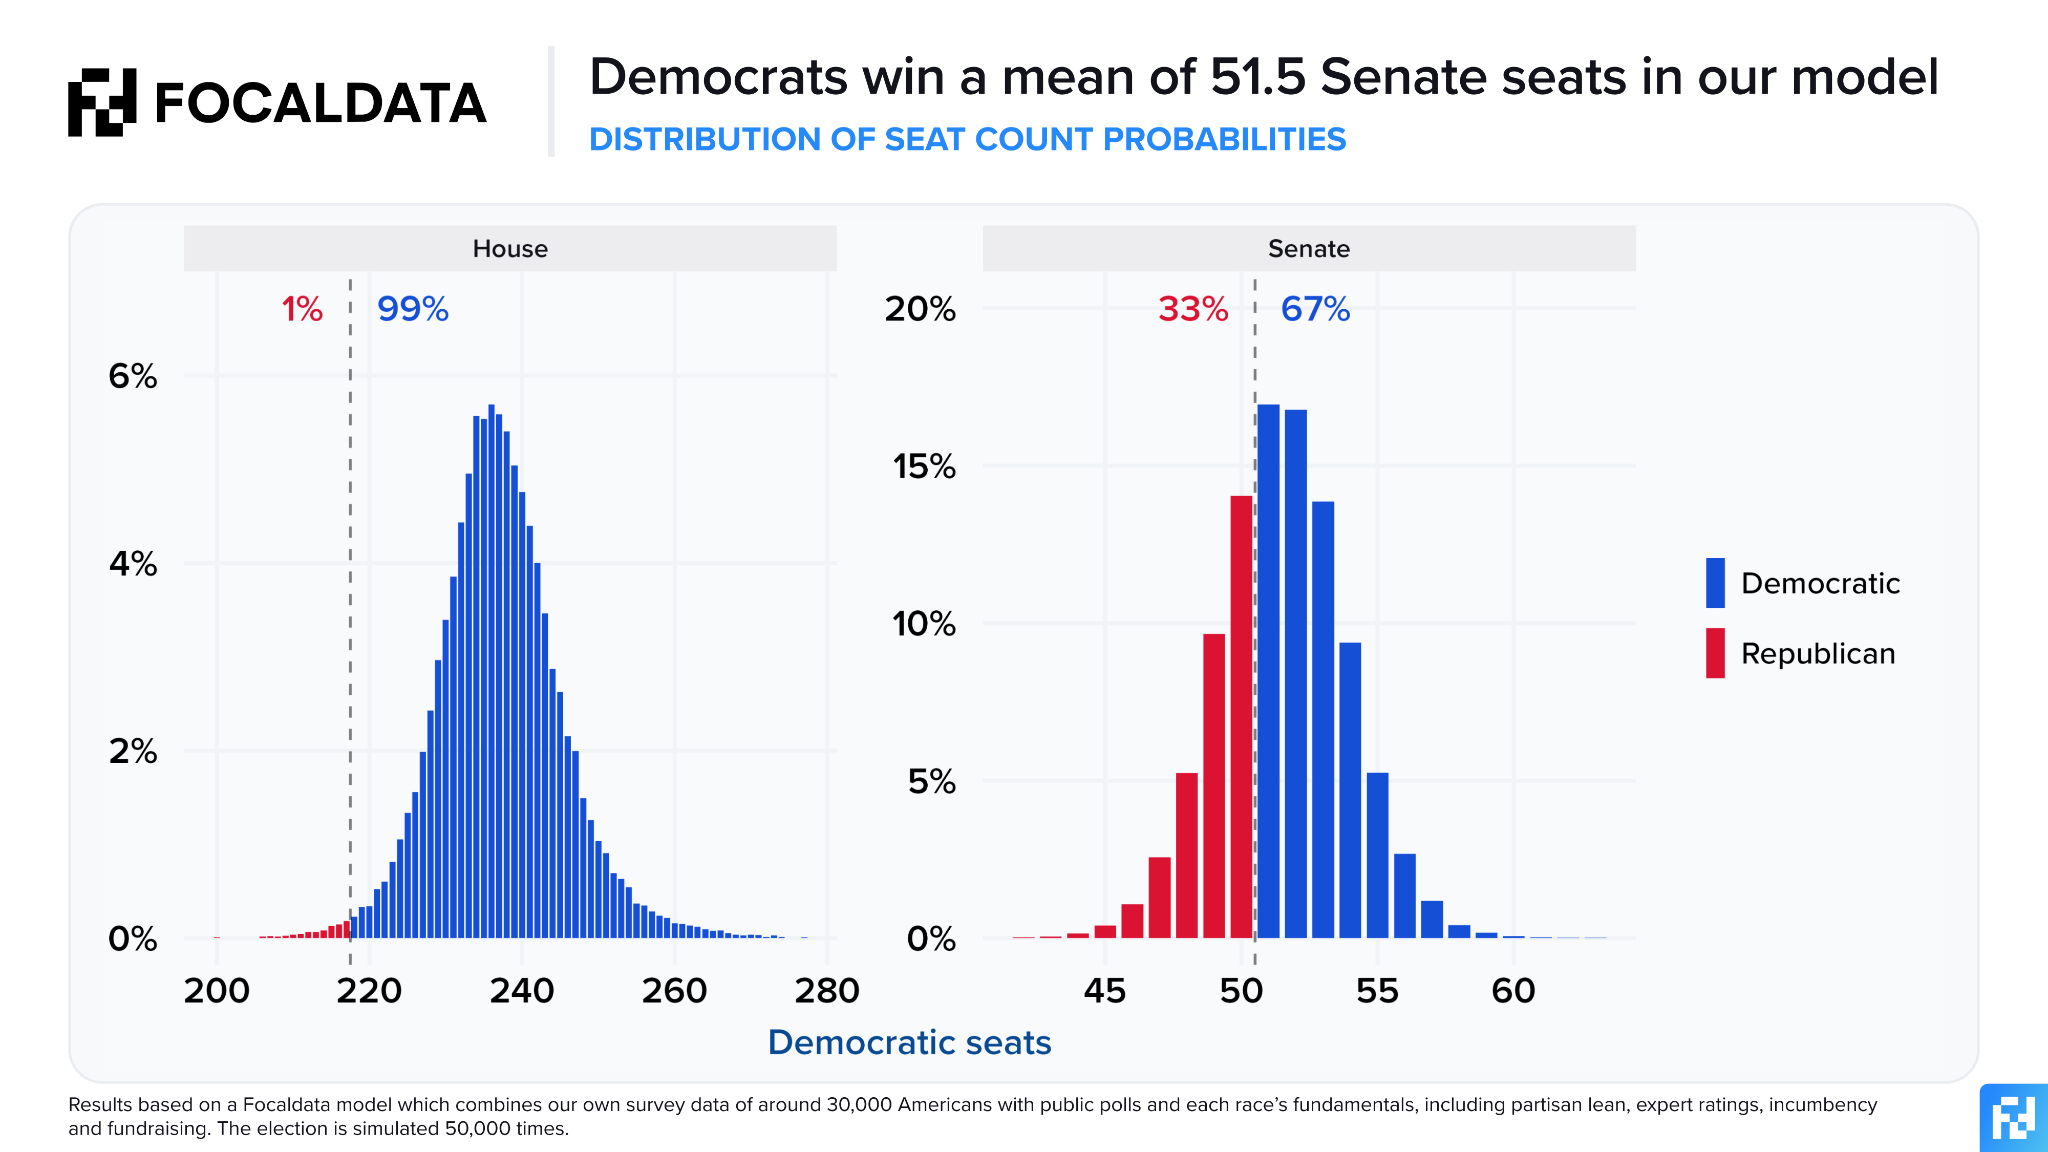
In the House, Democratic chances have risen steadily since the start of September, from around 70% to 99%. The Senate is much closer. Republicans were favoured in early September. The race then crossed over in the second half of the month, and Democrats have been favoured to win the Senate ever since. Their chances rose in the final days to 67% on election day, as the last polls and expert ratings came in.
Explore every race
The Senate races
We think Democrats are likely to hold all of their current seats. Michigan is the closest, at an 87% win chance.
In terms of flips, North Carolina is the most likely, at 98%. Maine comes next, at 75%. Texas and Ohio are both leaning Democratic, at 62% and 62%. Kansas, Iowa and Alaska lean Republican, but only just: our chance of a Democratic win is between 38% and 45% in each of those seats.
The Democratic path to Senate control will likely run through North Carolina, Maine, and then two of Texas, Ohio, Kansas, Iowa and Alaska.
Background on US polling
US polling often gets a bad rap. After some high-profile misses in 2016, 2020 and 2024 (all in the same direction), the typical responses from polling sceptics are that the industry is fundamentally flawed or deliberately biased, depending on one’s point of view.
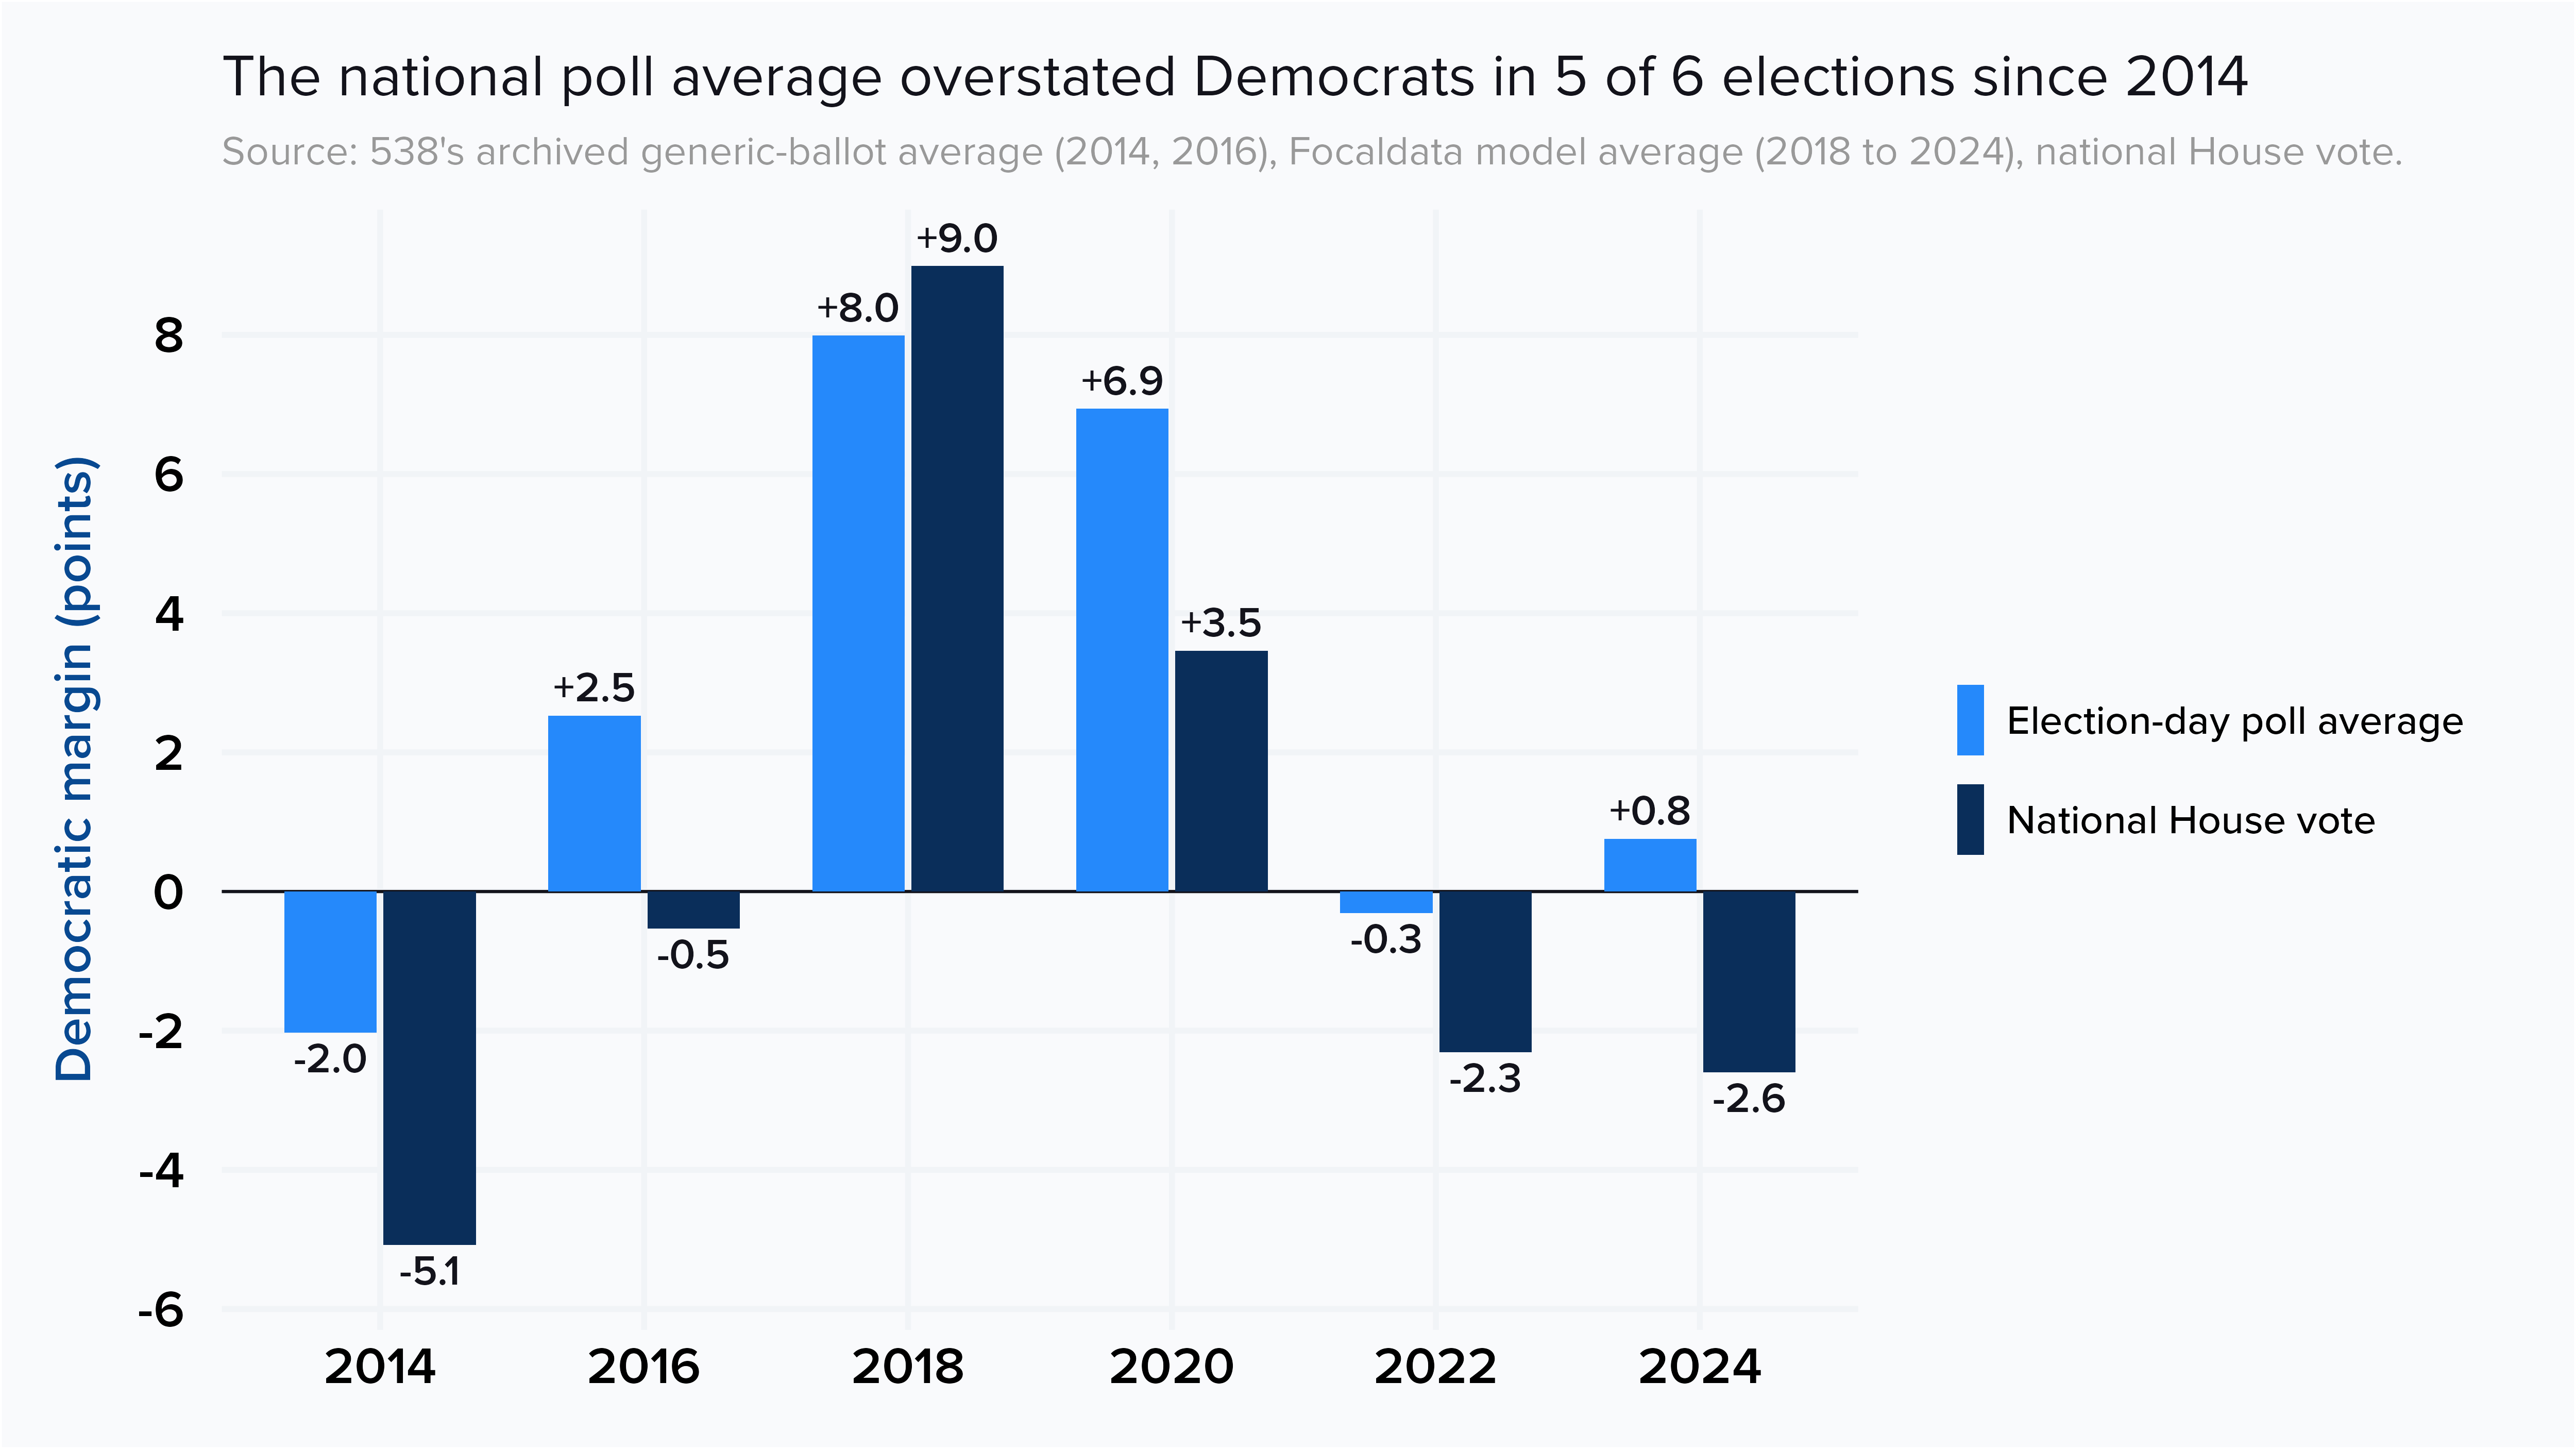
Misses in recent elections have not been huge by industry standards, typically around 2-3 points. The fact the polls have missed in the same direction time and time again has done more damage to trust than a single big miss because it looks like a pattern. As we will come onto, we believe it is a pattern.
The main cause of recent polling misses has been what is known as ‘non-ignorable non-response bias’. The conceptual idea behind polling and its accuracy is that people who take a survey can operate as suitable stand-ins for those who do not, and thus a survey of 3,000 people can produce reliable estimates of public opinion within a few percentage points of a country of 300 million people.
Non-response bias in the abstract is the phenomenon in which the probability of responding to a survey differs between various groups. For example, rural respondents might be less likely to take online surveys, or those with lower levels of education might feel less confident in picking up the phone to discuss their views on politics at length. We can treat non-response bias as ‘ignorable’ when response propensity differs along observable lines, and we can weight away those gaps. If rural respondents with low levels of education who do answer a survey hold similar views on the variable we are trying to measure (who they plan to vote for) to non-degree educated rural respondents who do not answer surveys, weighting will make sure the overall distribution of respondents broadly matches the population as a whole, and we should get a fairly accurate estimate of overall voting intention for the country.
Bias becomes non-ignorable when response propensity depends on an unobserved value, even after weighting. We might find that polls underestimate Donald Trump’s true level of support because they do not have enough low-trust Republicans in the sample, even after controlling for a variety of demographic variables like education, rurality, or past vote. We can make sure a survey has broadly the correct number of Republican voters in it by weighting to past vote or party registration, but if the Republicans who take surveys differ significantly from those who do not, the polls run into trouble.

The Republican Party’s transformation over the last decade, particularly its MAGA wing, into a party dominated by voters with low levels of institutional trust and lower levels of political interest has fed through into polling.
Republicans with low levels of trust and political interest are significantly less likely to respond to surveys, but are significantly more likely to continue to support the party from election to election. We see this empirically, both in public datasets and in our own data.
If a survey has enough Republicans in its sample, but not enough low-trust Republicans, the results are likely to underestimate the amount of Republican vote retention. In 2020, there was a 24-point gap in Trump vote retention between his 2016 voters who said they had no trust in the news media (90% retention), versus those who had at least a moderate amount of trust (66% retention). The same pattern held from 2020 to 2024, with a 10-point gap. The data we have collected across 2026 shows the same relationship, at a 7-point gap.

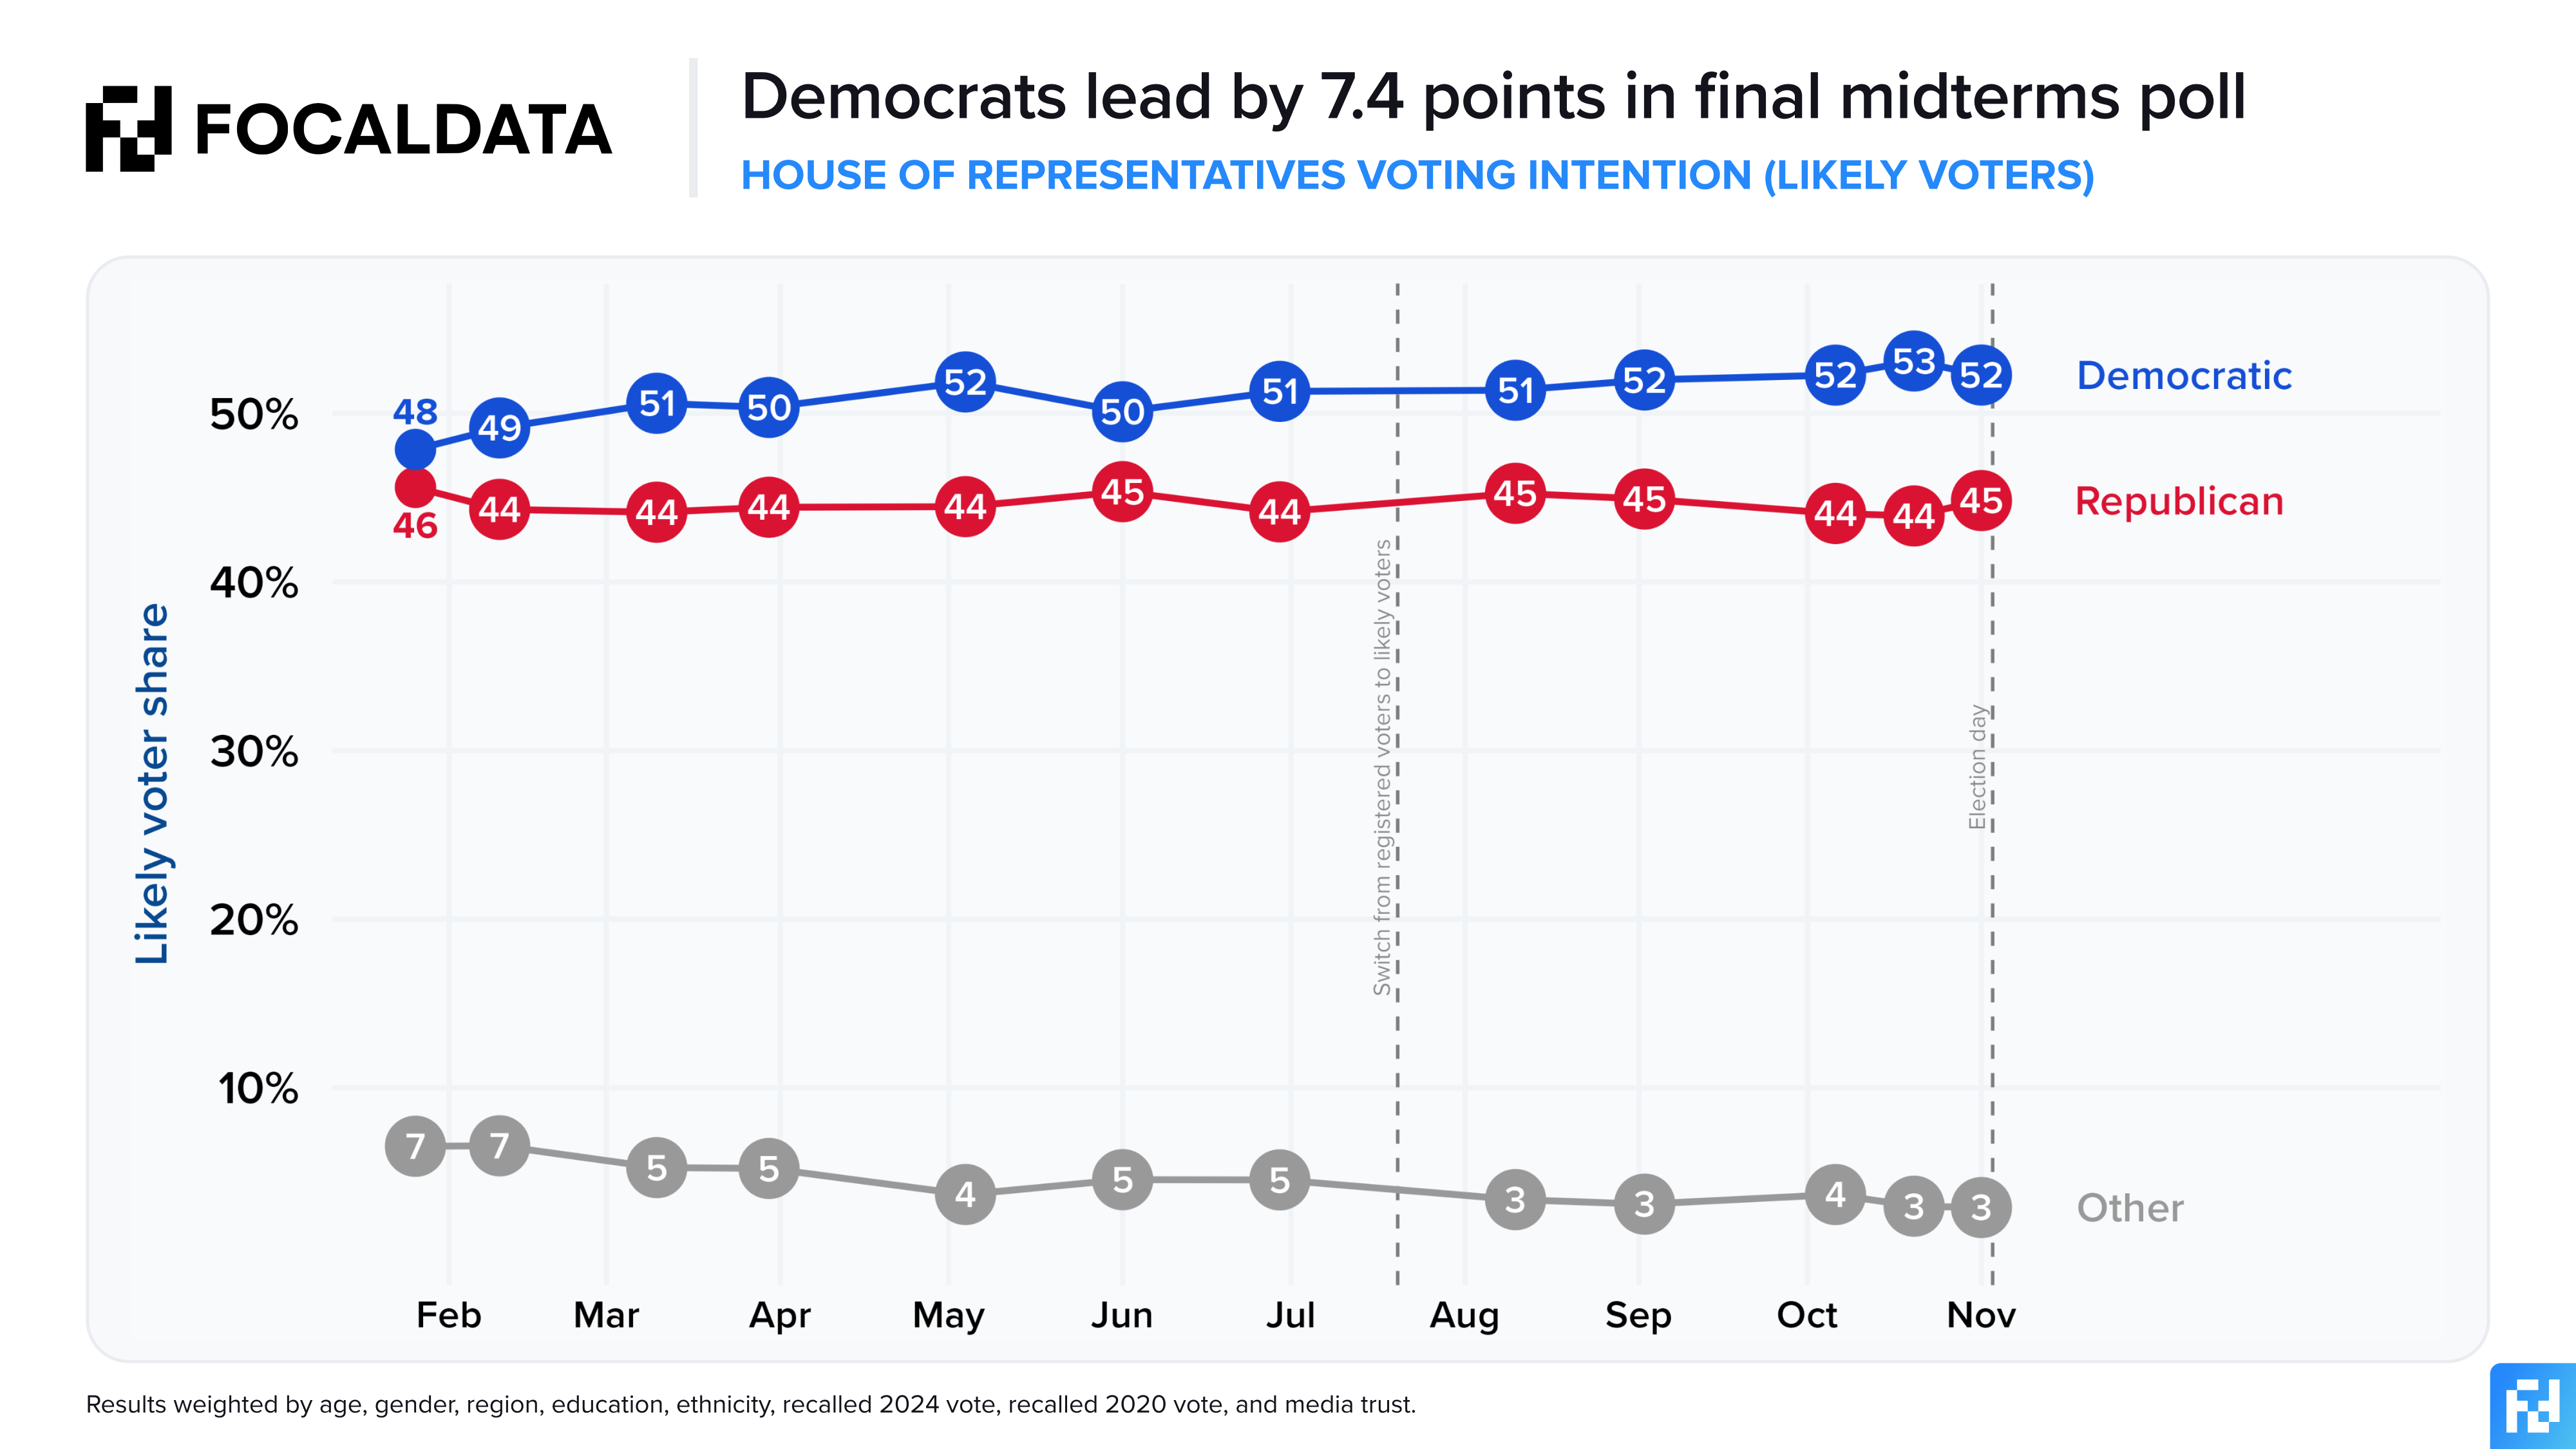
Our polls weight on media trust, deriving population targets from non-response-adjusted estimates of the population at large from ANES panel study data. As we noted above, our final poll of the midterm elections gave the Democrats a 7.4-point lead in the generic ballot.
We have done significant amounts of testing on our weighting schemes to minimise bias. Weighting on social trust fixes much of the issue, but without using (expensive) random probability samples and creating sophisticated models to estimate the views of non-respondents, traditional methods may only get us so far.
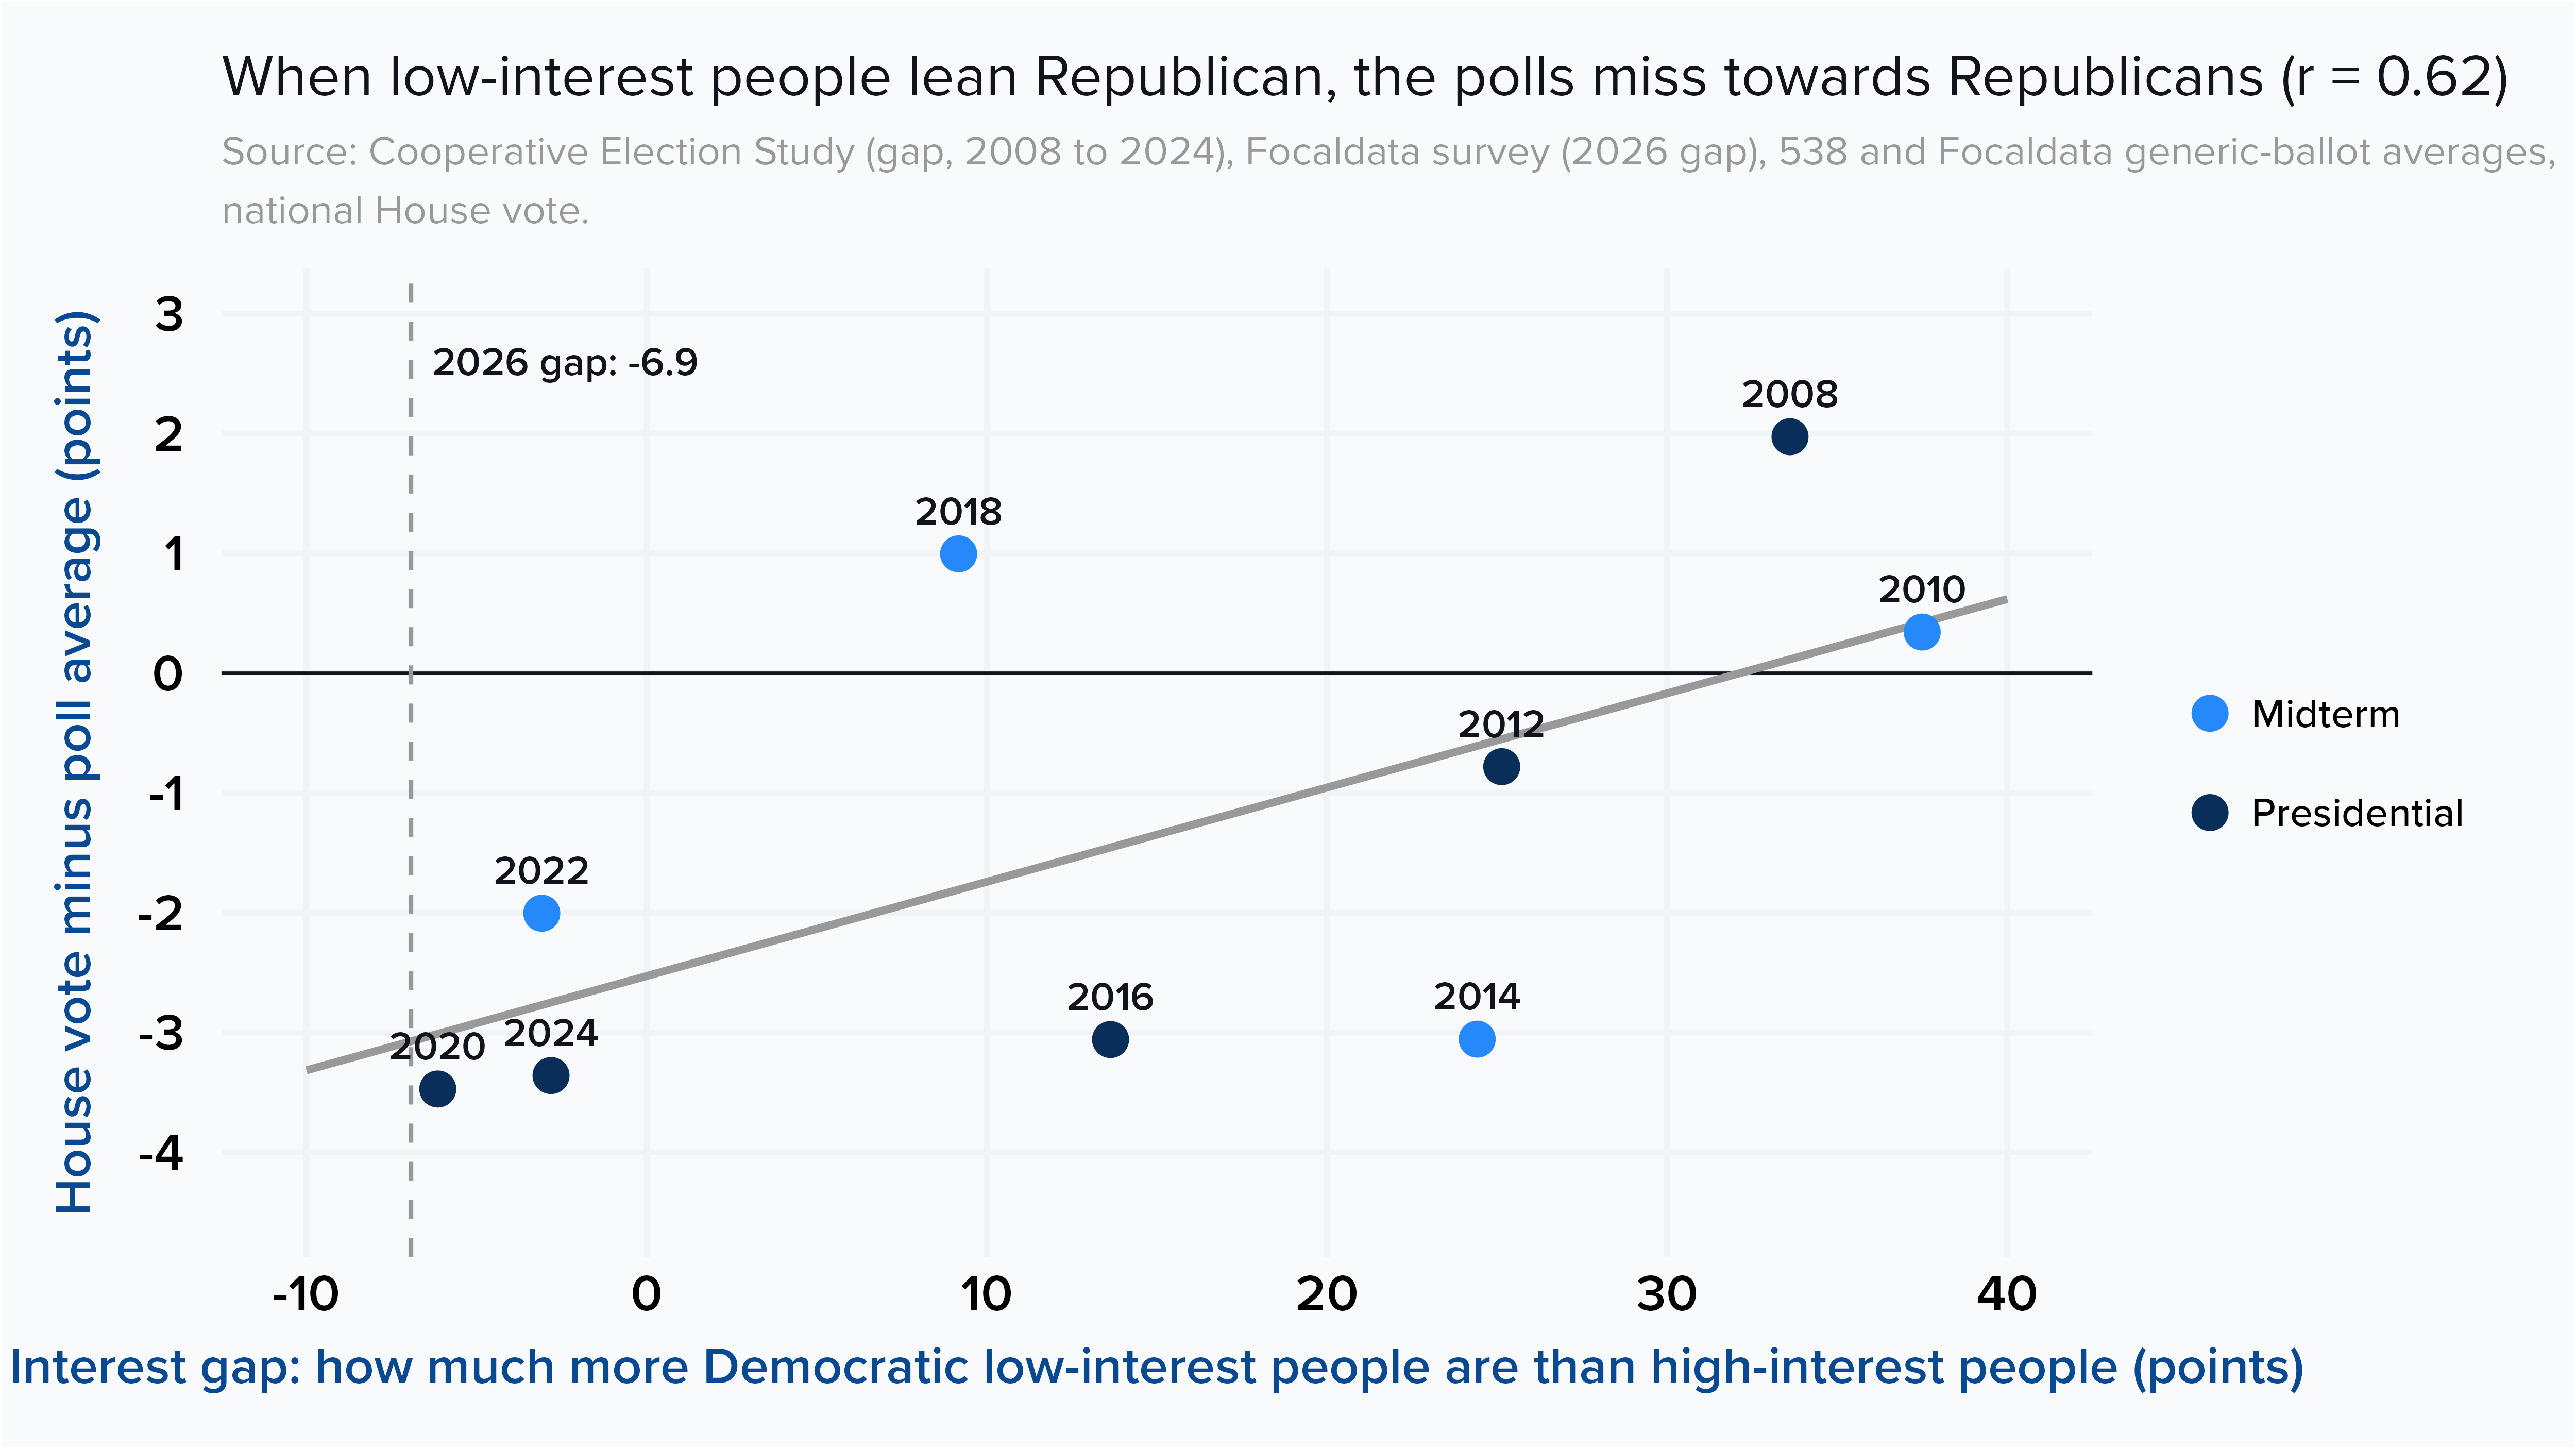
Our analysis shows that polling error over the last two decades correlates with the partisan makeup of voters with low levels of political interest (which typically correlates with social trust). When the gap between low-interest and high-interest voters becomes more Republican, the polls overstate the Democrats by more.
You may come across the view that you ‘cannot predict the direction of polling error in advance’. We do not subscribe to this view. Expecting polling error to be as likely on one side as it is on another is itself an assumption. It is an assumption which flies in the face of growing evidence (see the above, and this recent academic paper). Given what we know about polling history, survey methodology and response rates, we expect a polling error which overestimates the Democrats to be more likely than not. This is not to say that the polls will overestimate the Democrats. A perfectly normal polling error could well see the Democrats underestimated, but our evidence-based prior is that national polling error is not equally likely in either direction. Our prior is that the polls will overestimate the Democrats by around 1 point in the generic ballot.
Synthesising data sources
Taking a combination of traditional polling, MRP, and fundamentals usually points you closer to the answer than any of those does alone. Some of the fundamentals in 2024 pointed towards a Trump victory, or at least a race that was too close to call.
Trump’s issue handling in that election frequently outpaced his headline vote share, with a weighted lead on respondents’ most important issues of around 1.5 to 2 percentage points in the swing states, closely aligned with the overall results.

When the fundamentals and other predictors do not match the headline vote shares in the public polling, we should be less confident in the headline vote share accuracy. When they align, we can be more confident.
Where the forecast could be wrong
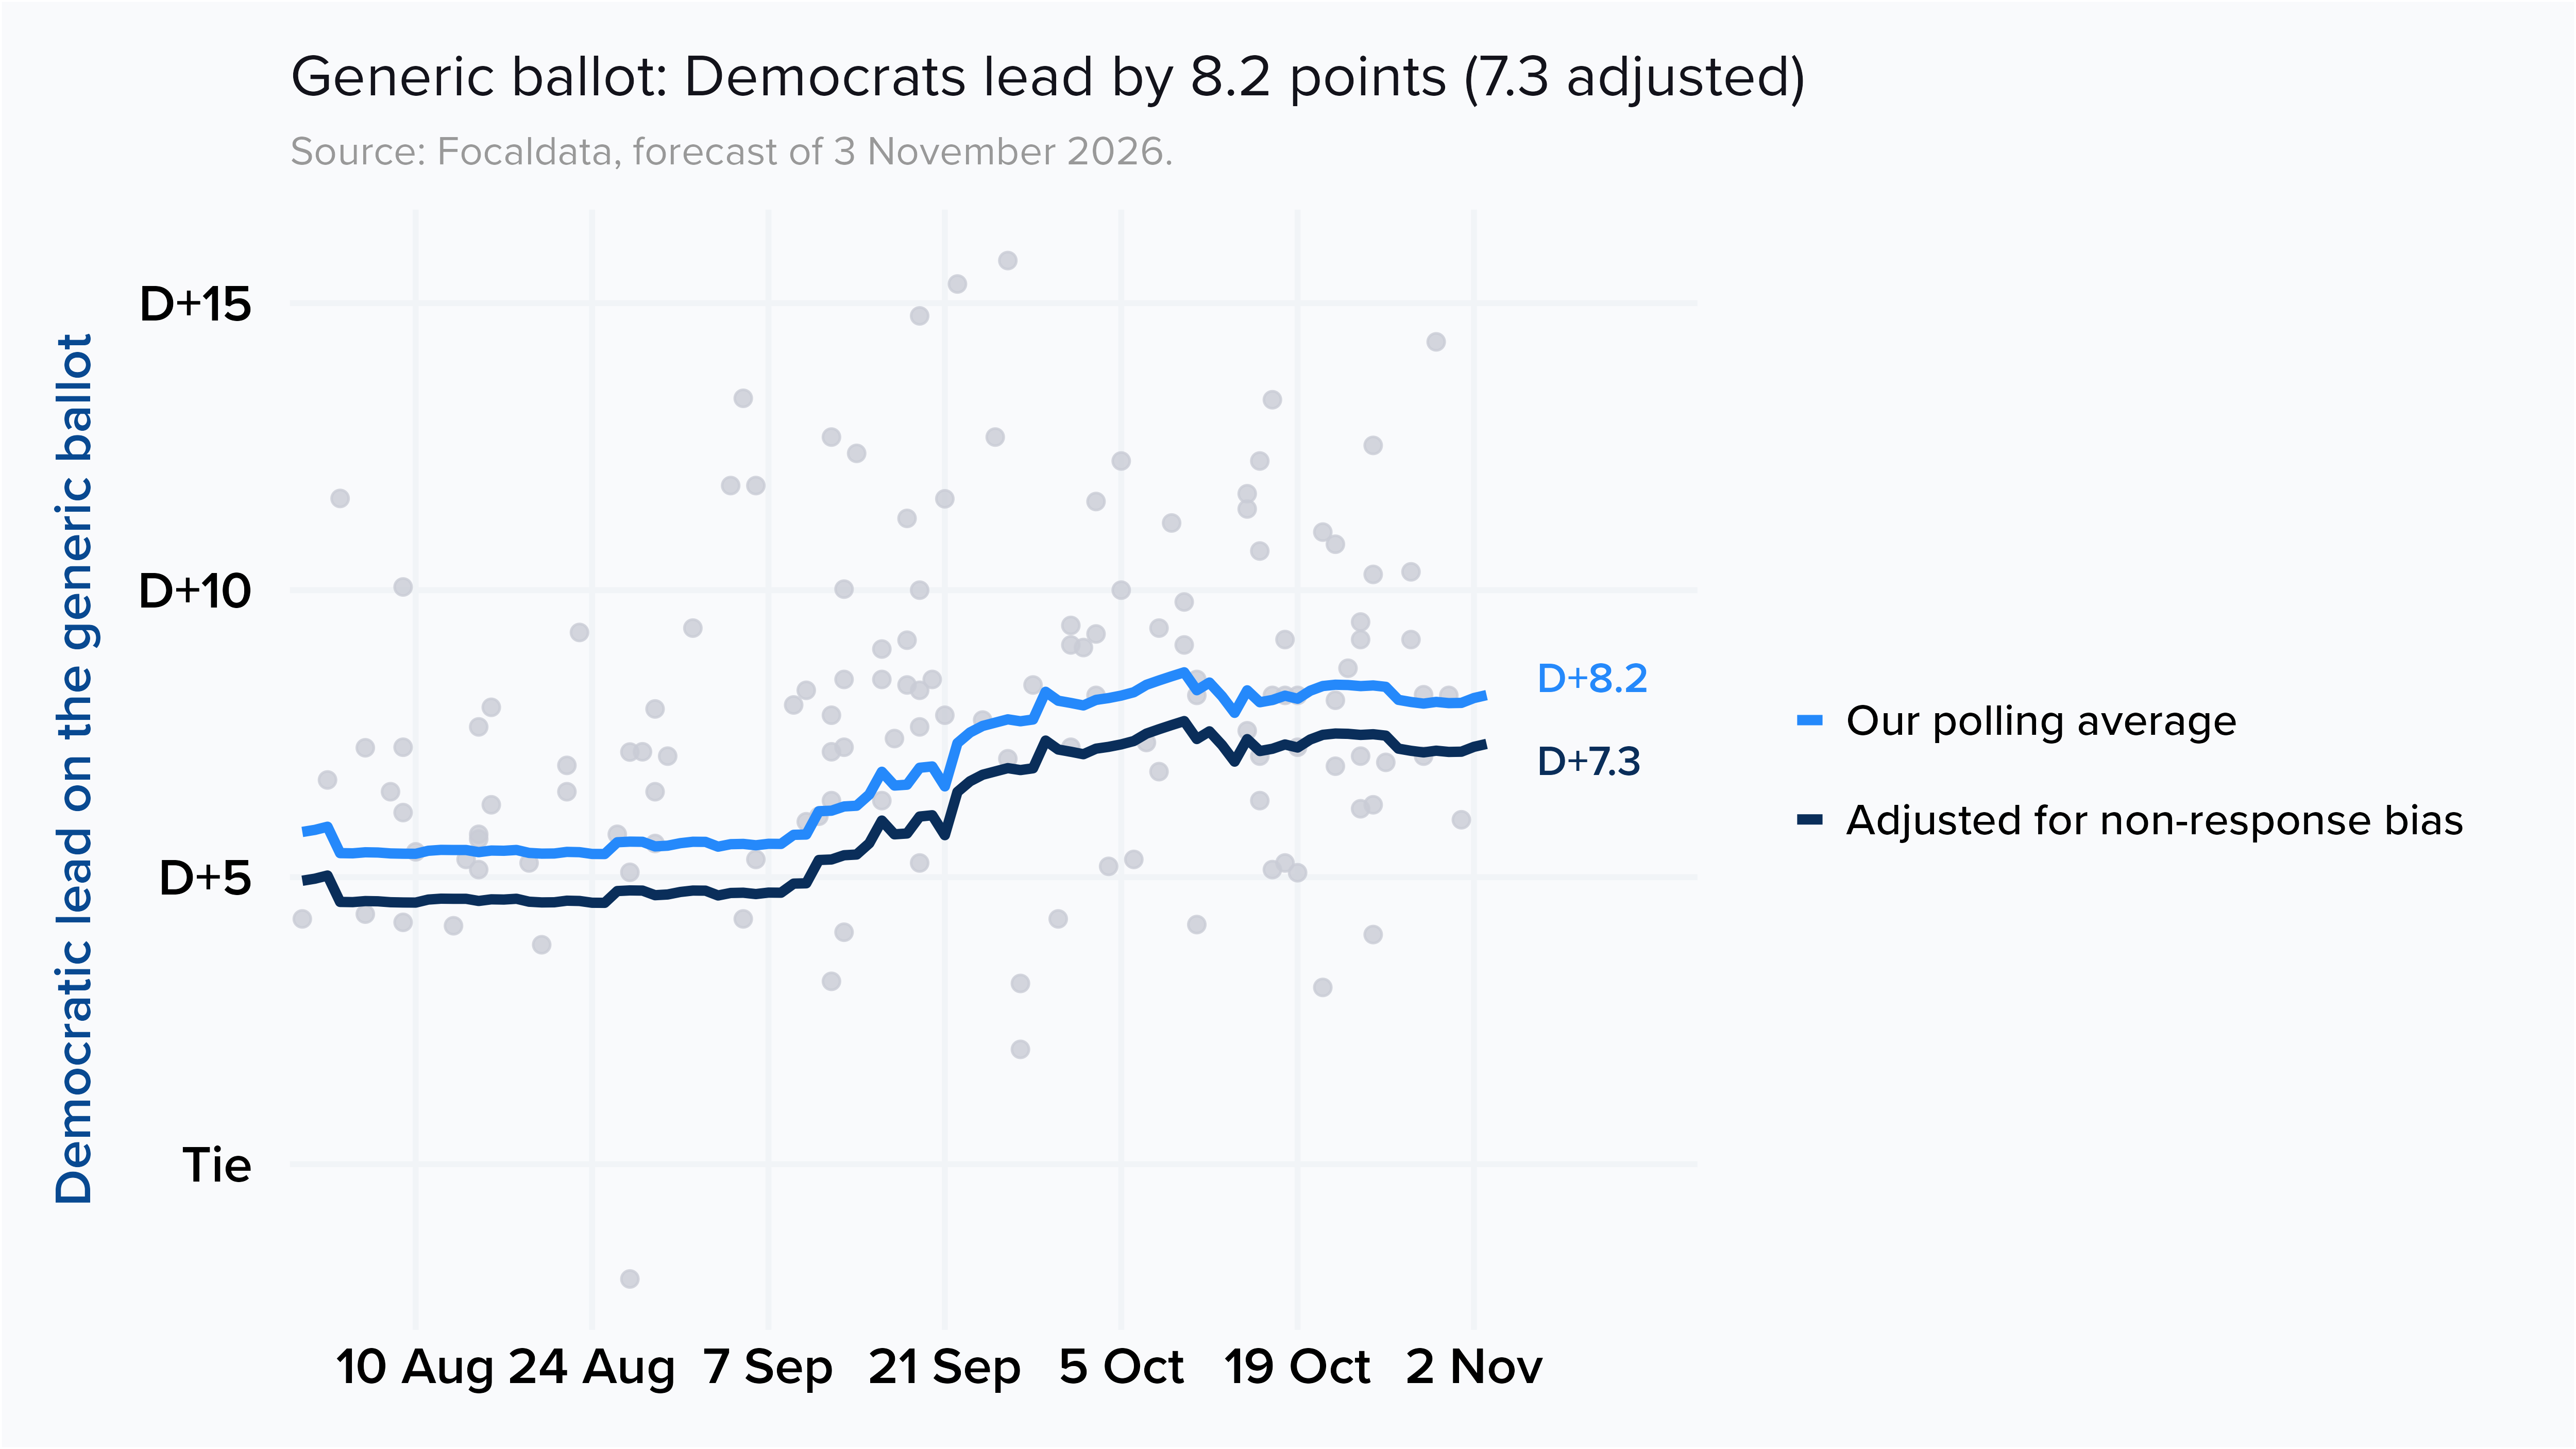
Non-ignorable non-response bias (which we explain above) is one of the main reasons the polls might be wrong, and we make some adjustments for it. These equate to just under 1 point on the national picture: the polling average of D+8.2 becomes D+7.3.
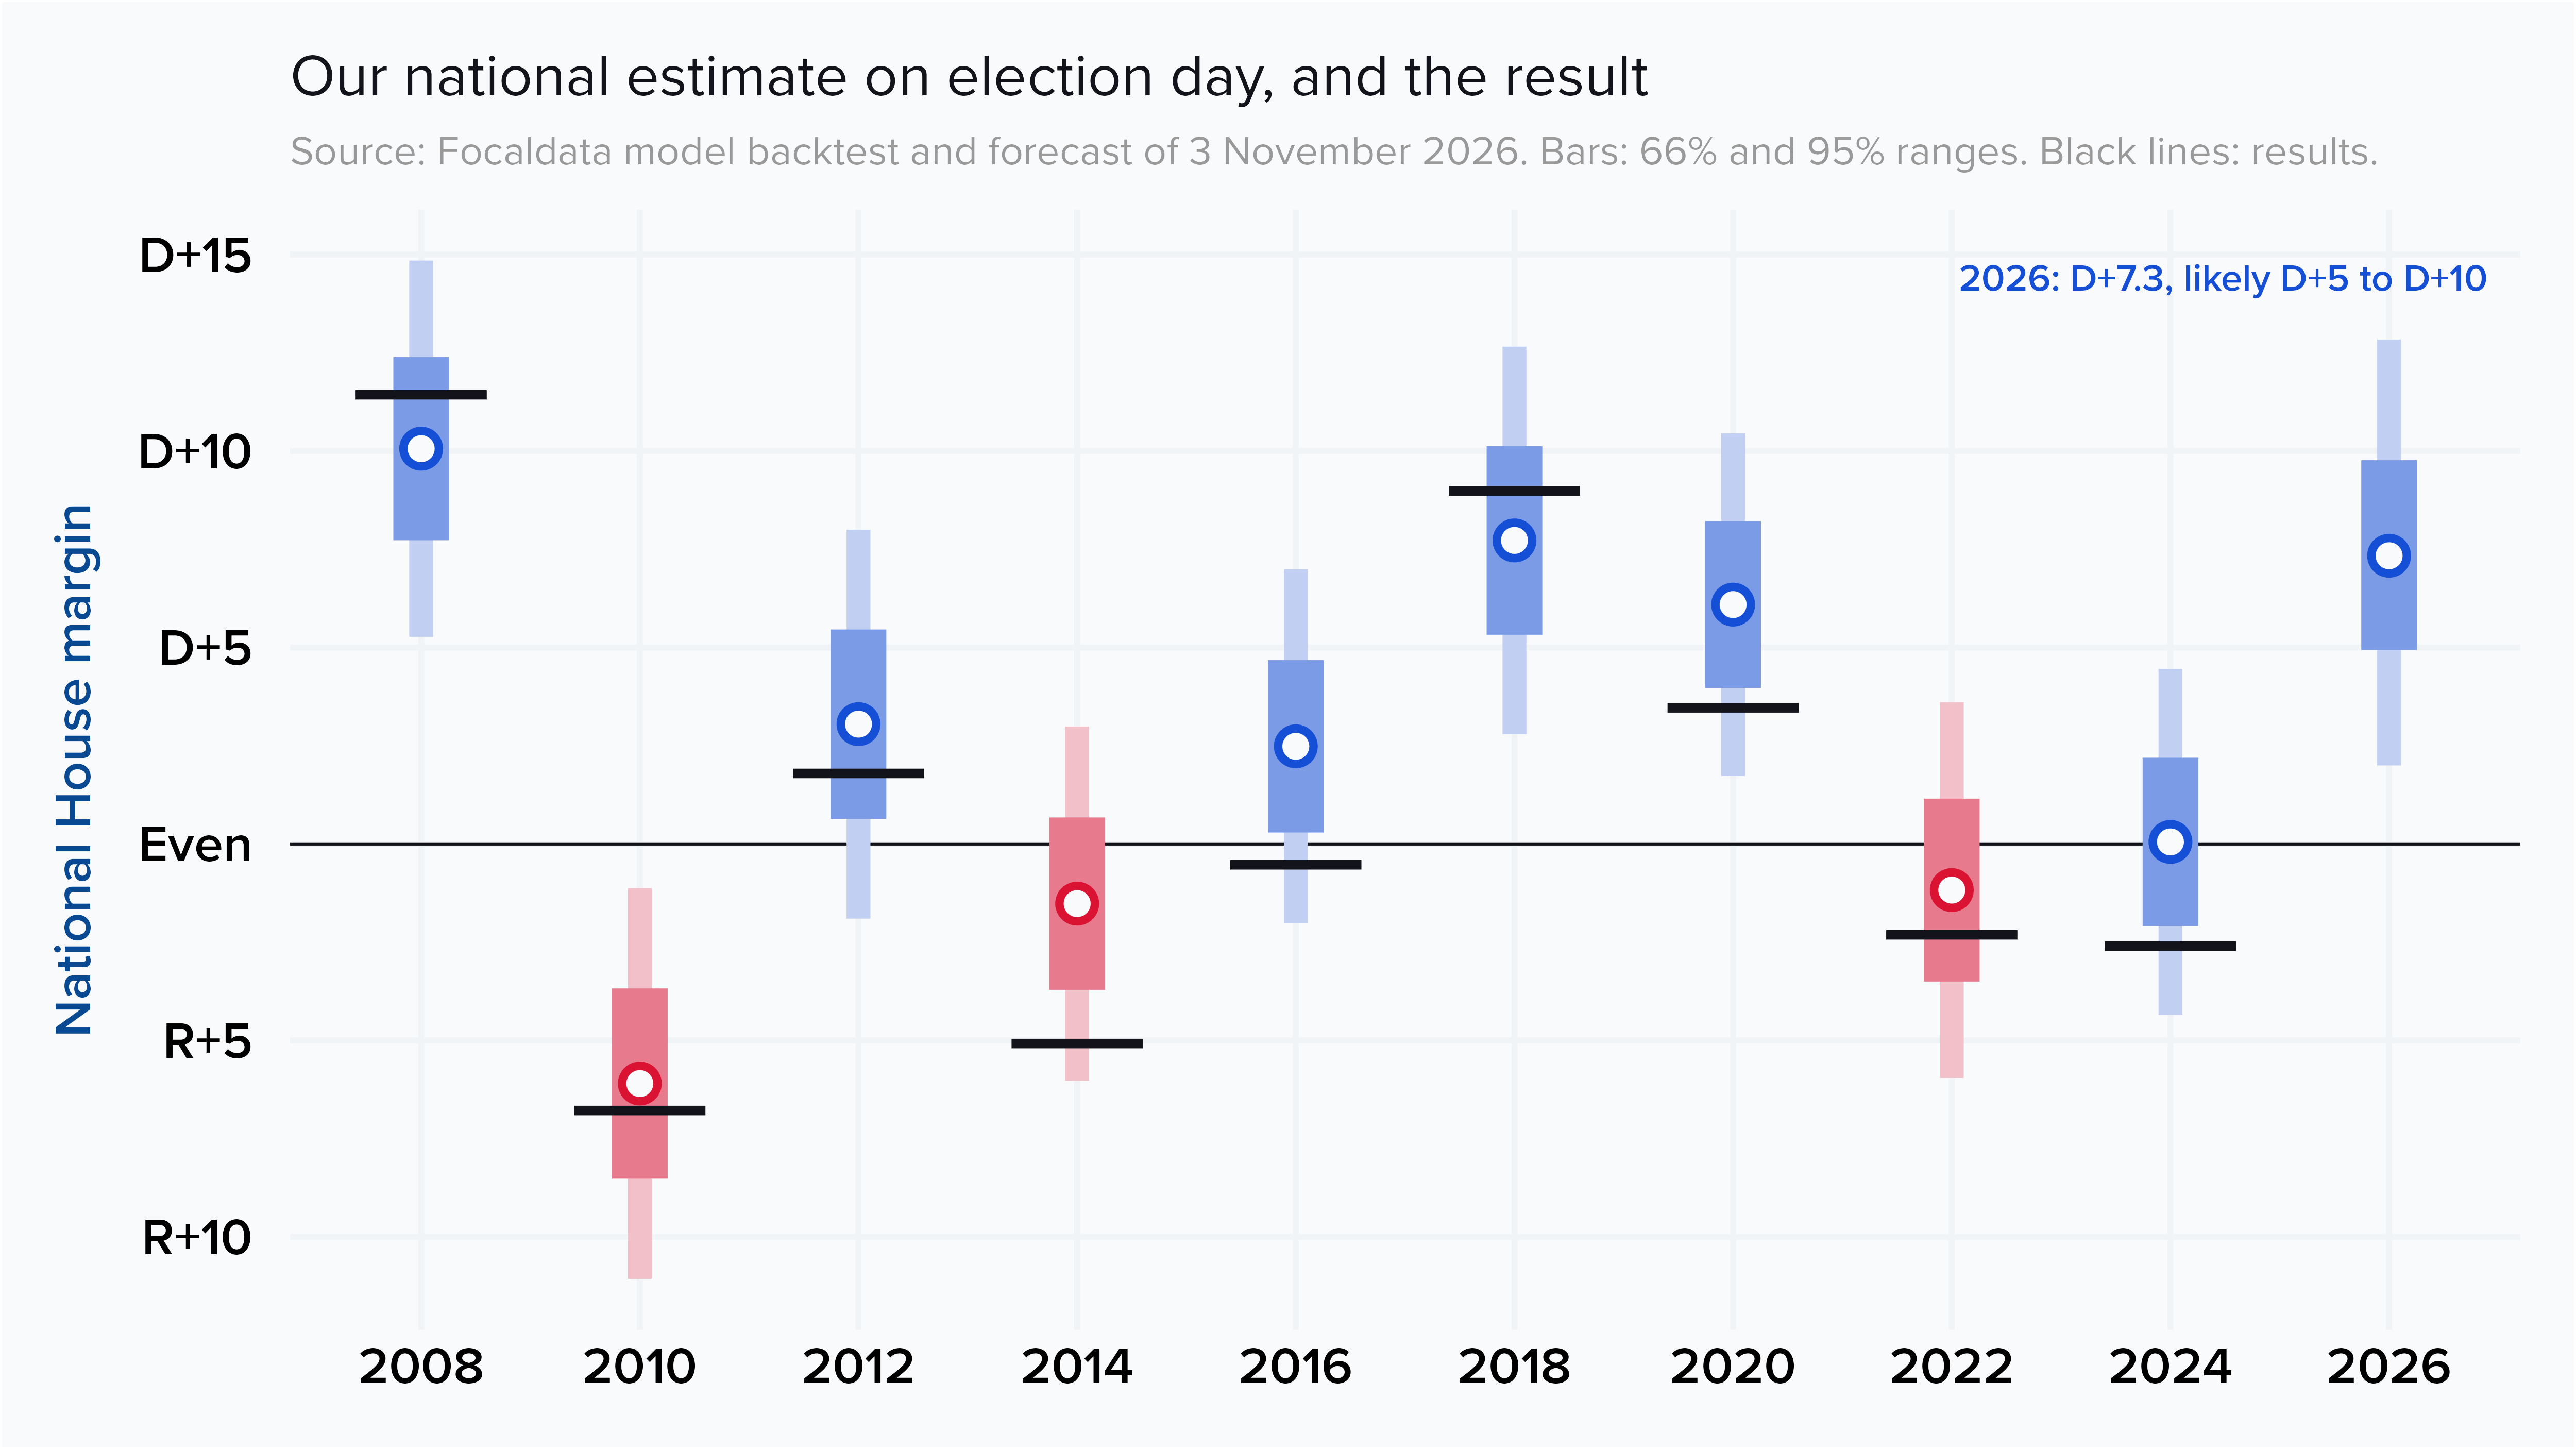
The chart below shows how the model tests against the past. We rebuilt our forecast for every election since 2008. The dots are our national estimate, the bars are the 66% and 95% ranges, and the black lines are the actual results. For 2026, our national estimate is a Democratic lead of 7.3 points, with a 2-in-3 chance of a lead between 5 and 10 points. Polling error could go in either direction. A double-digit Democratic national lead would be well within the range of a normal-sized polling error!
What a bad or good night for the Democrats might look like
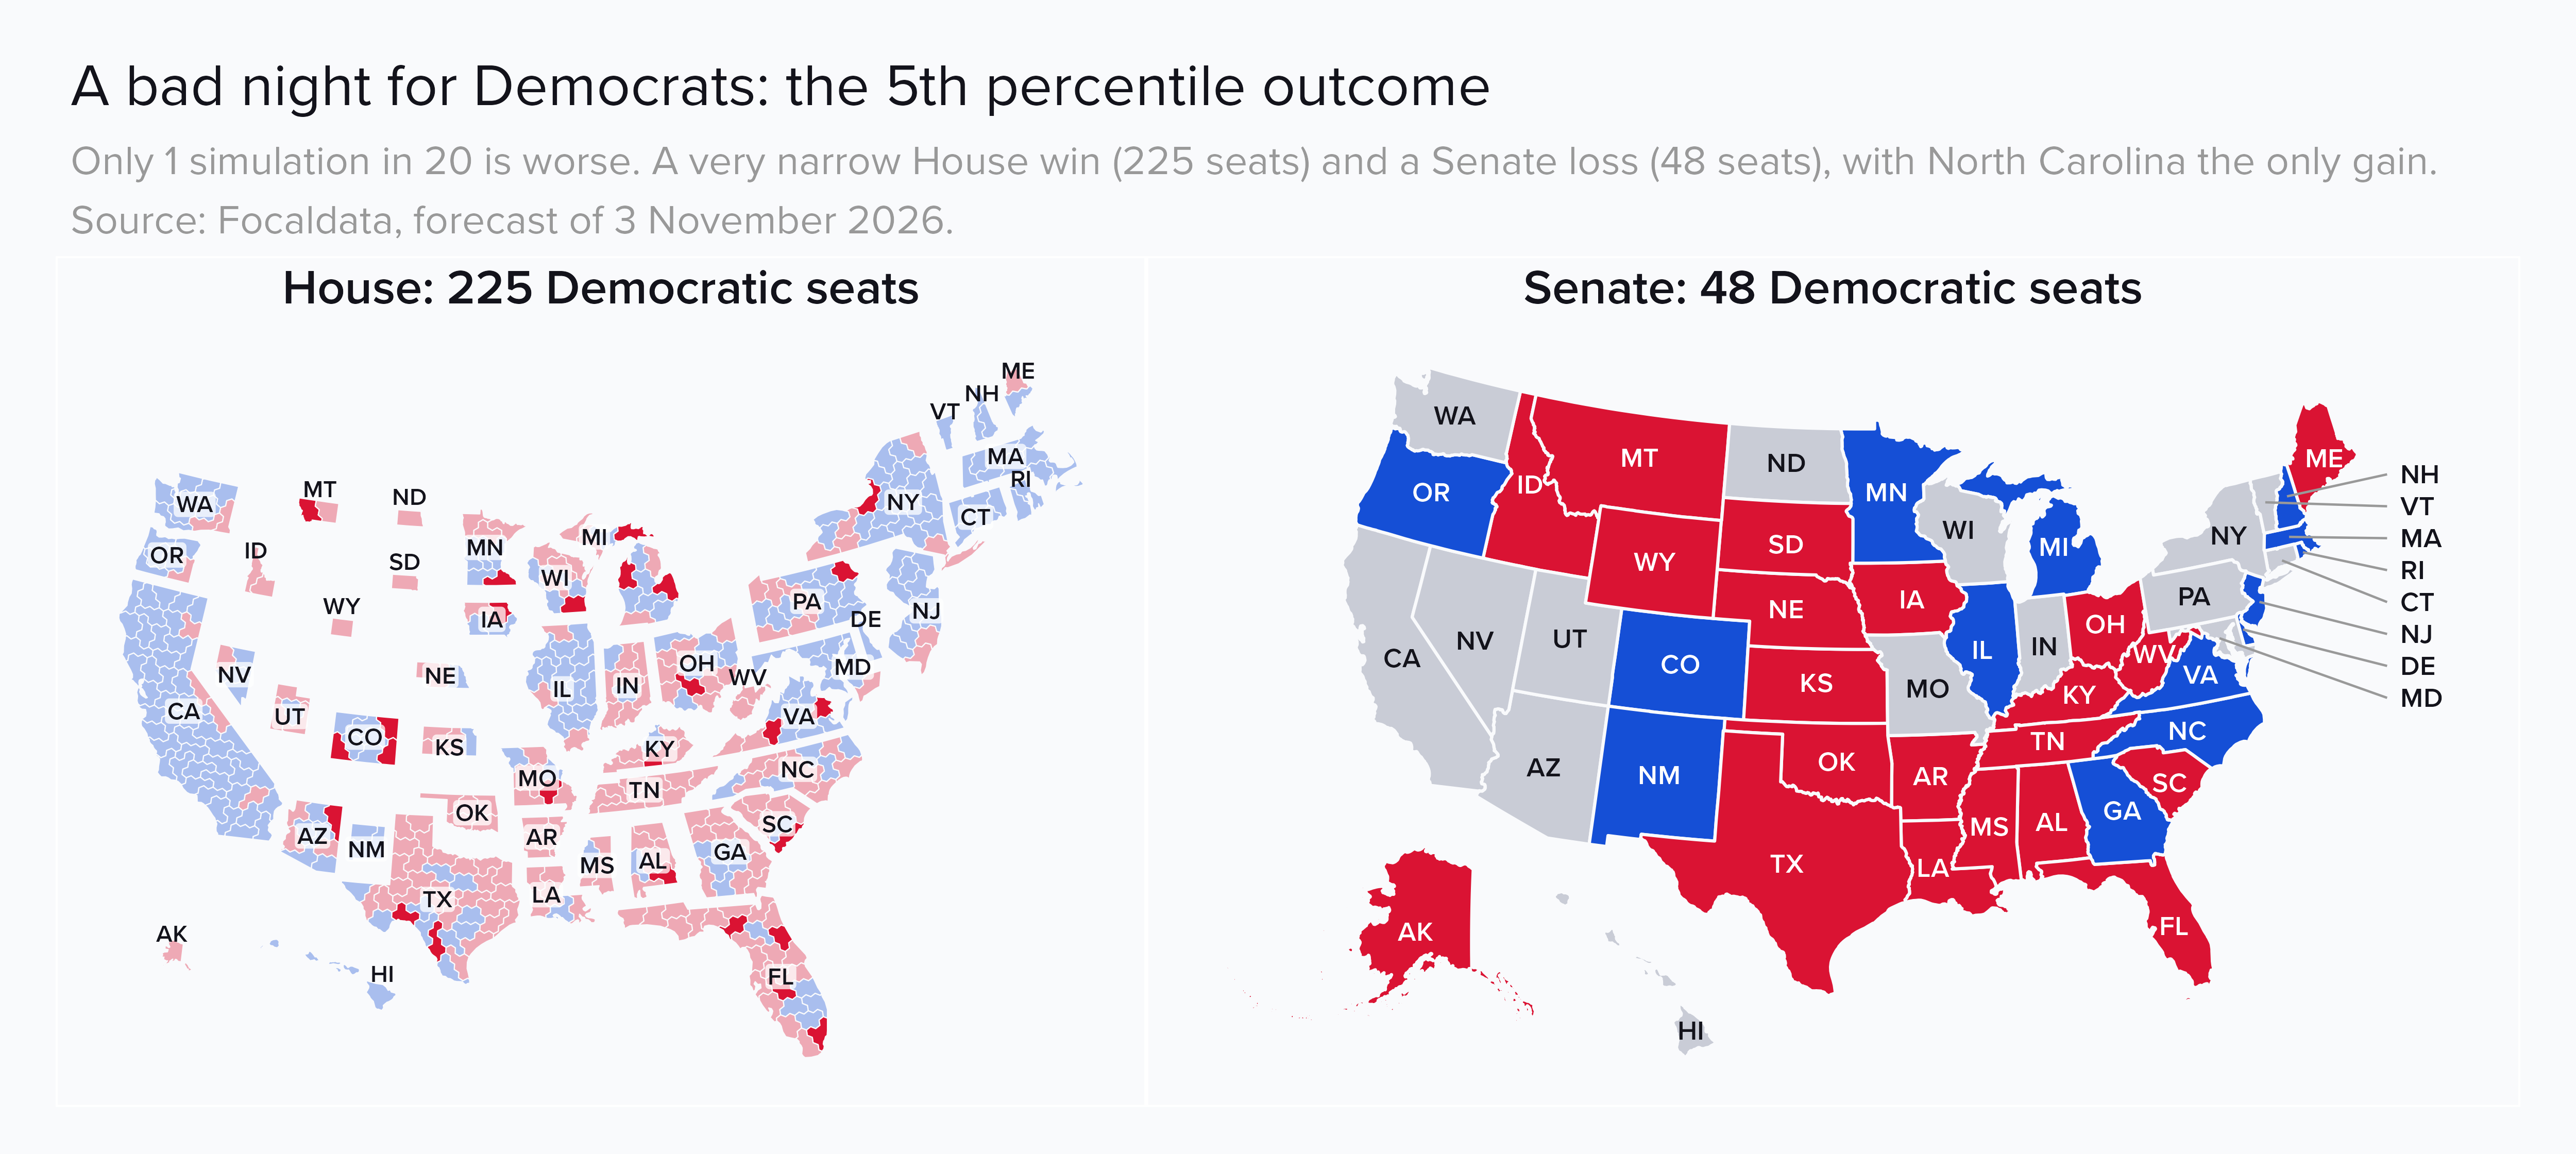
To give you an idea of a normal range of outcomes, we have produced two opposing scenarios – one in which the Democrats perform at the lower end of our expectations (the 5th percentile outcome), and one at the upper end (the 95th percentile).
On a bad night, the Democrats would still win the House, but very narrowly, with 225 seats. The Republicans would hold the Senate, with the Democrats only gaining North Carolina.
On a good night, the Democrats would win a blowout in the House, with 251 seats. They would also win the Senate comfortably, with eight flips: North Carolina, Maine, Texas, Ohio, Kansas, Iowa, Alaska and Louisiana.

What the public polling is saying (including our own)
Democrats have a clear lead in the generic ballot, and taking the House looks very likely. Our polling average gives the Democrats a lead of 8.2 points. The lead has grown since early September and has been stable for the last few weeks. After adjusting for expected non-response bias (more on this below), our central estimate is 7.3 points.
Serendipitously, our final national poll of the election gave the Democrats a 7.4-point lead in the House generic ballot among likely voters.
In the Senate, Democrats are ahead in the public polls in six seats that the Republicans currently hold: North Carolina, Maine, Texas, Ohio, Kansas and Alaska. Winning all six would take the Democrats to 53 Senate seats.
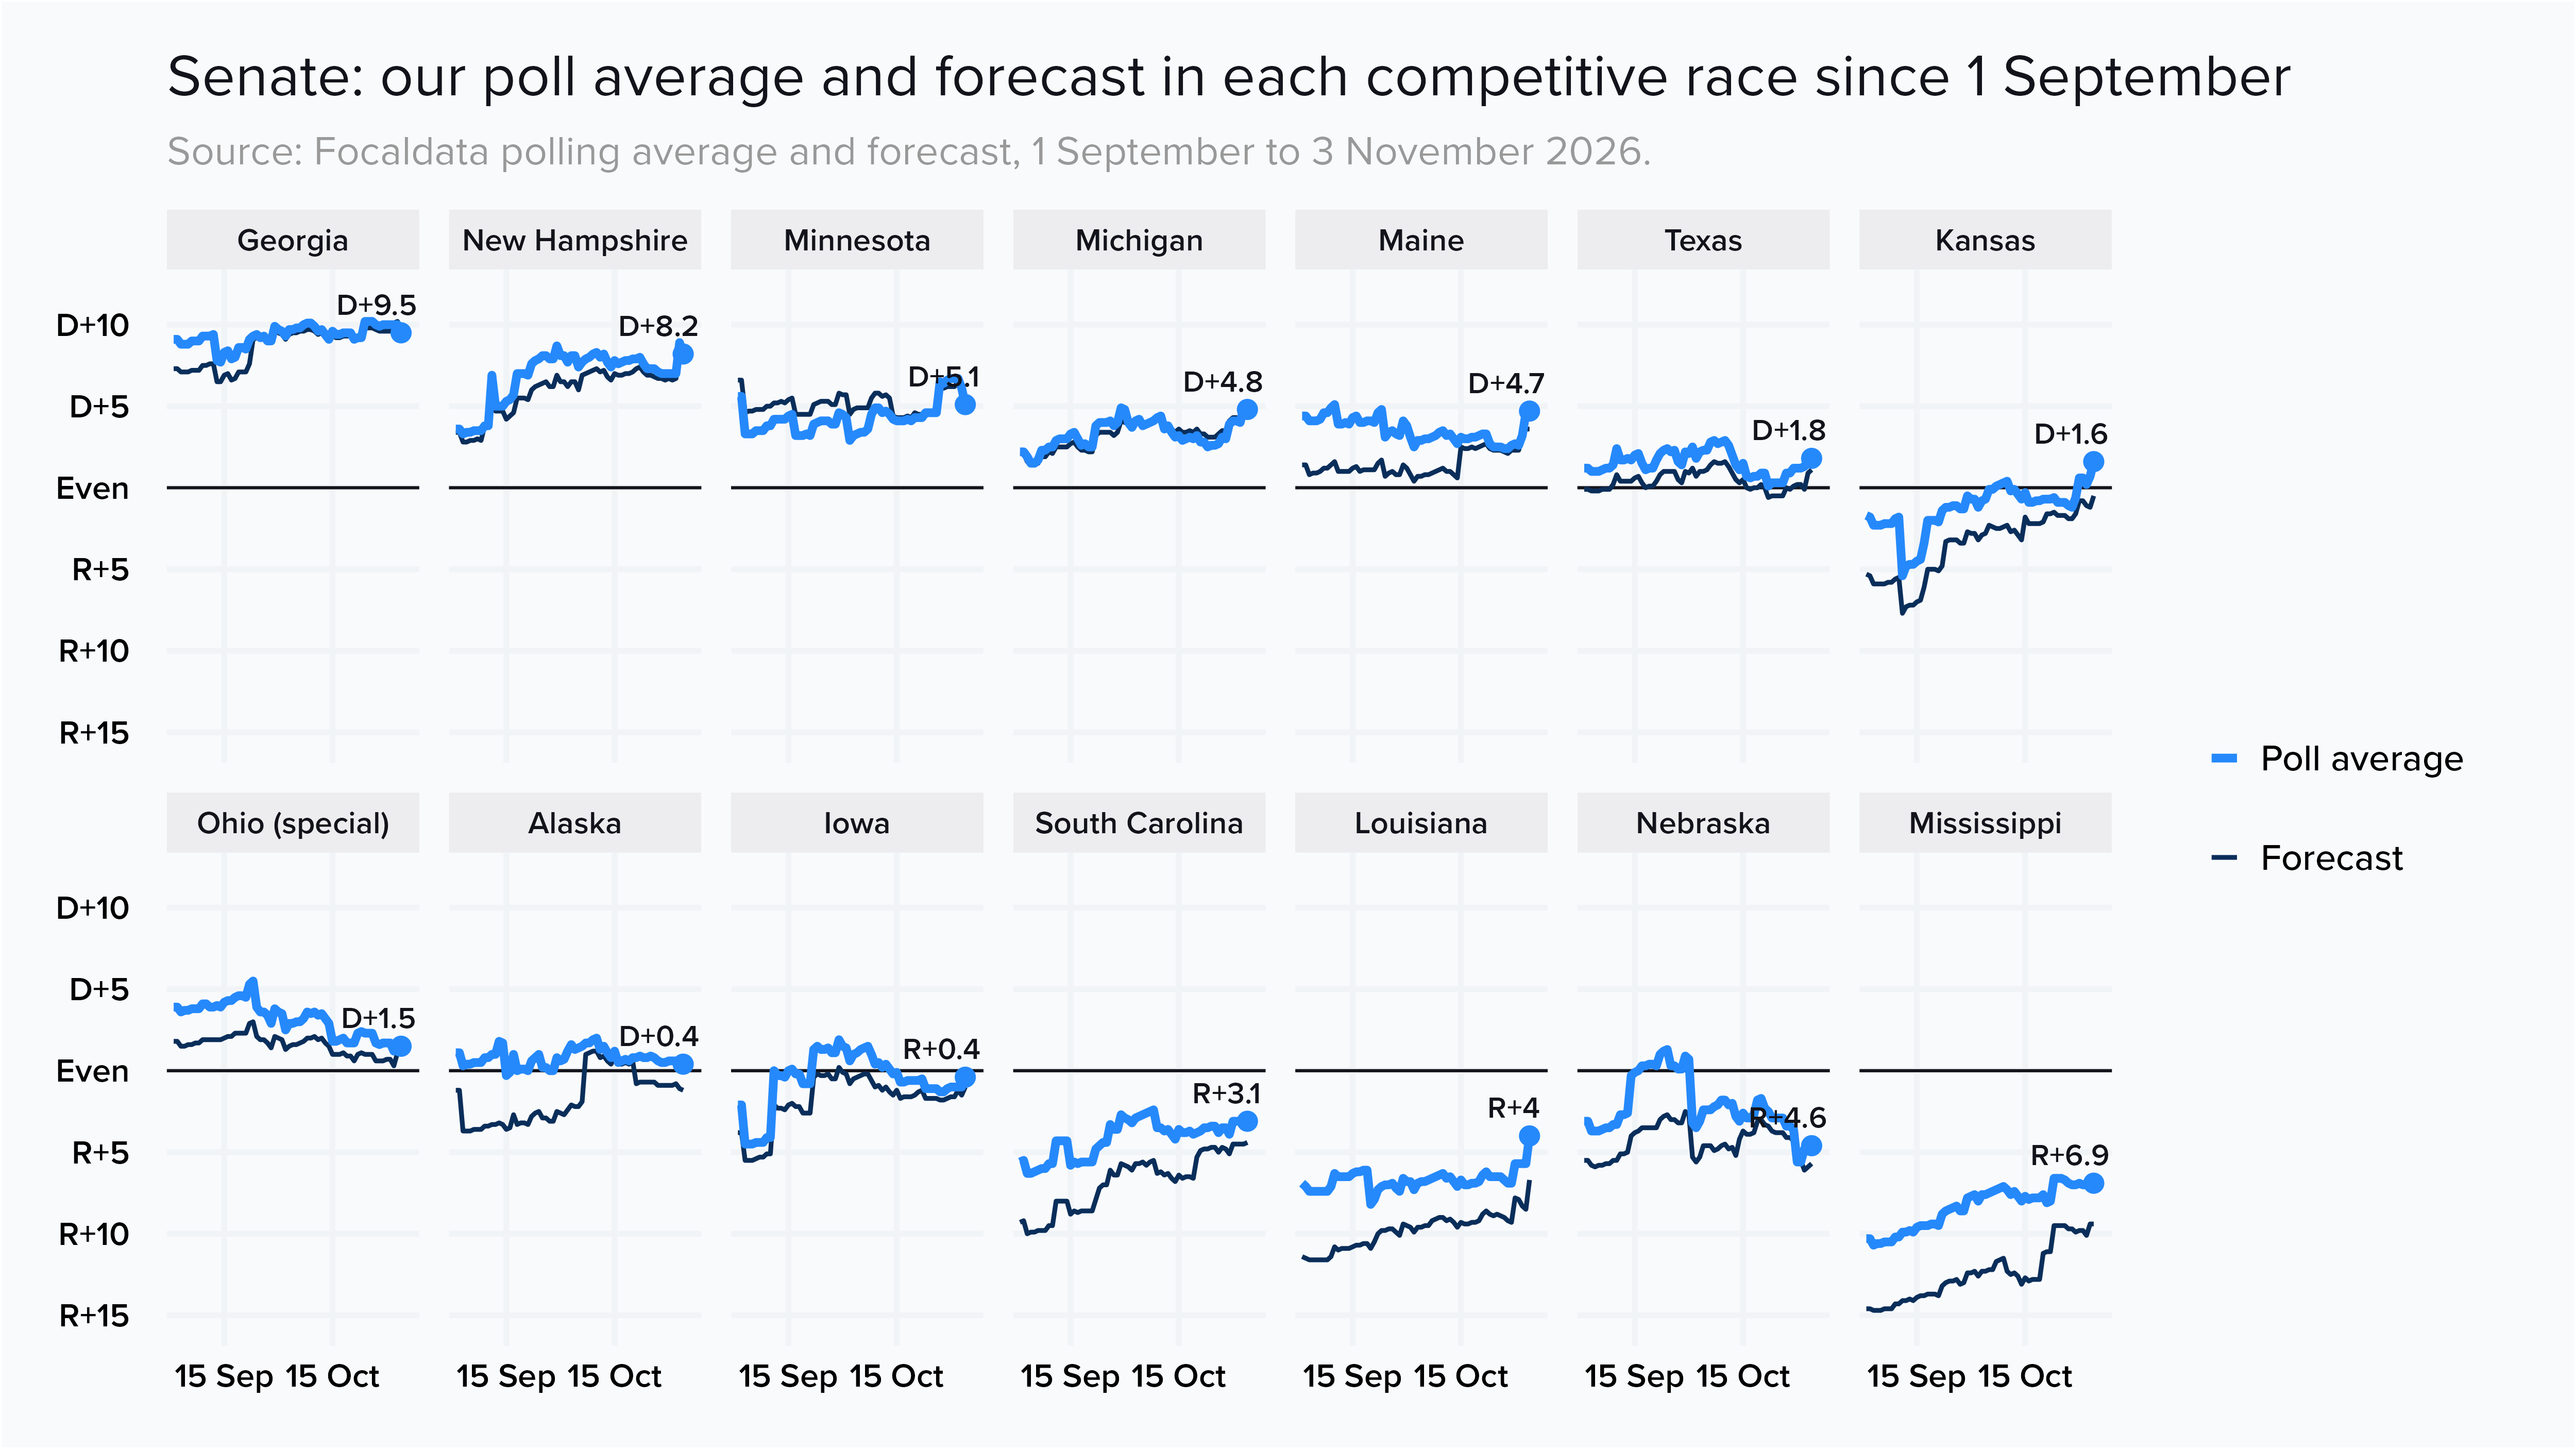
These are raw polling averages. They do not account for non-response bias, or for the fact that polls tend to overestimate Democrats in heavily Republican seats and vice versa – both of which our model accounts for.
What the fundamentals say
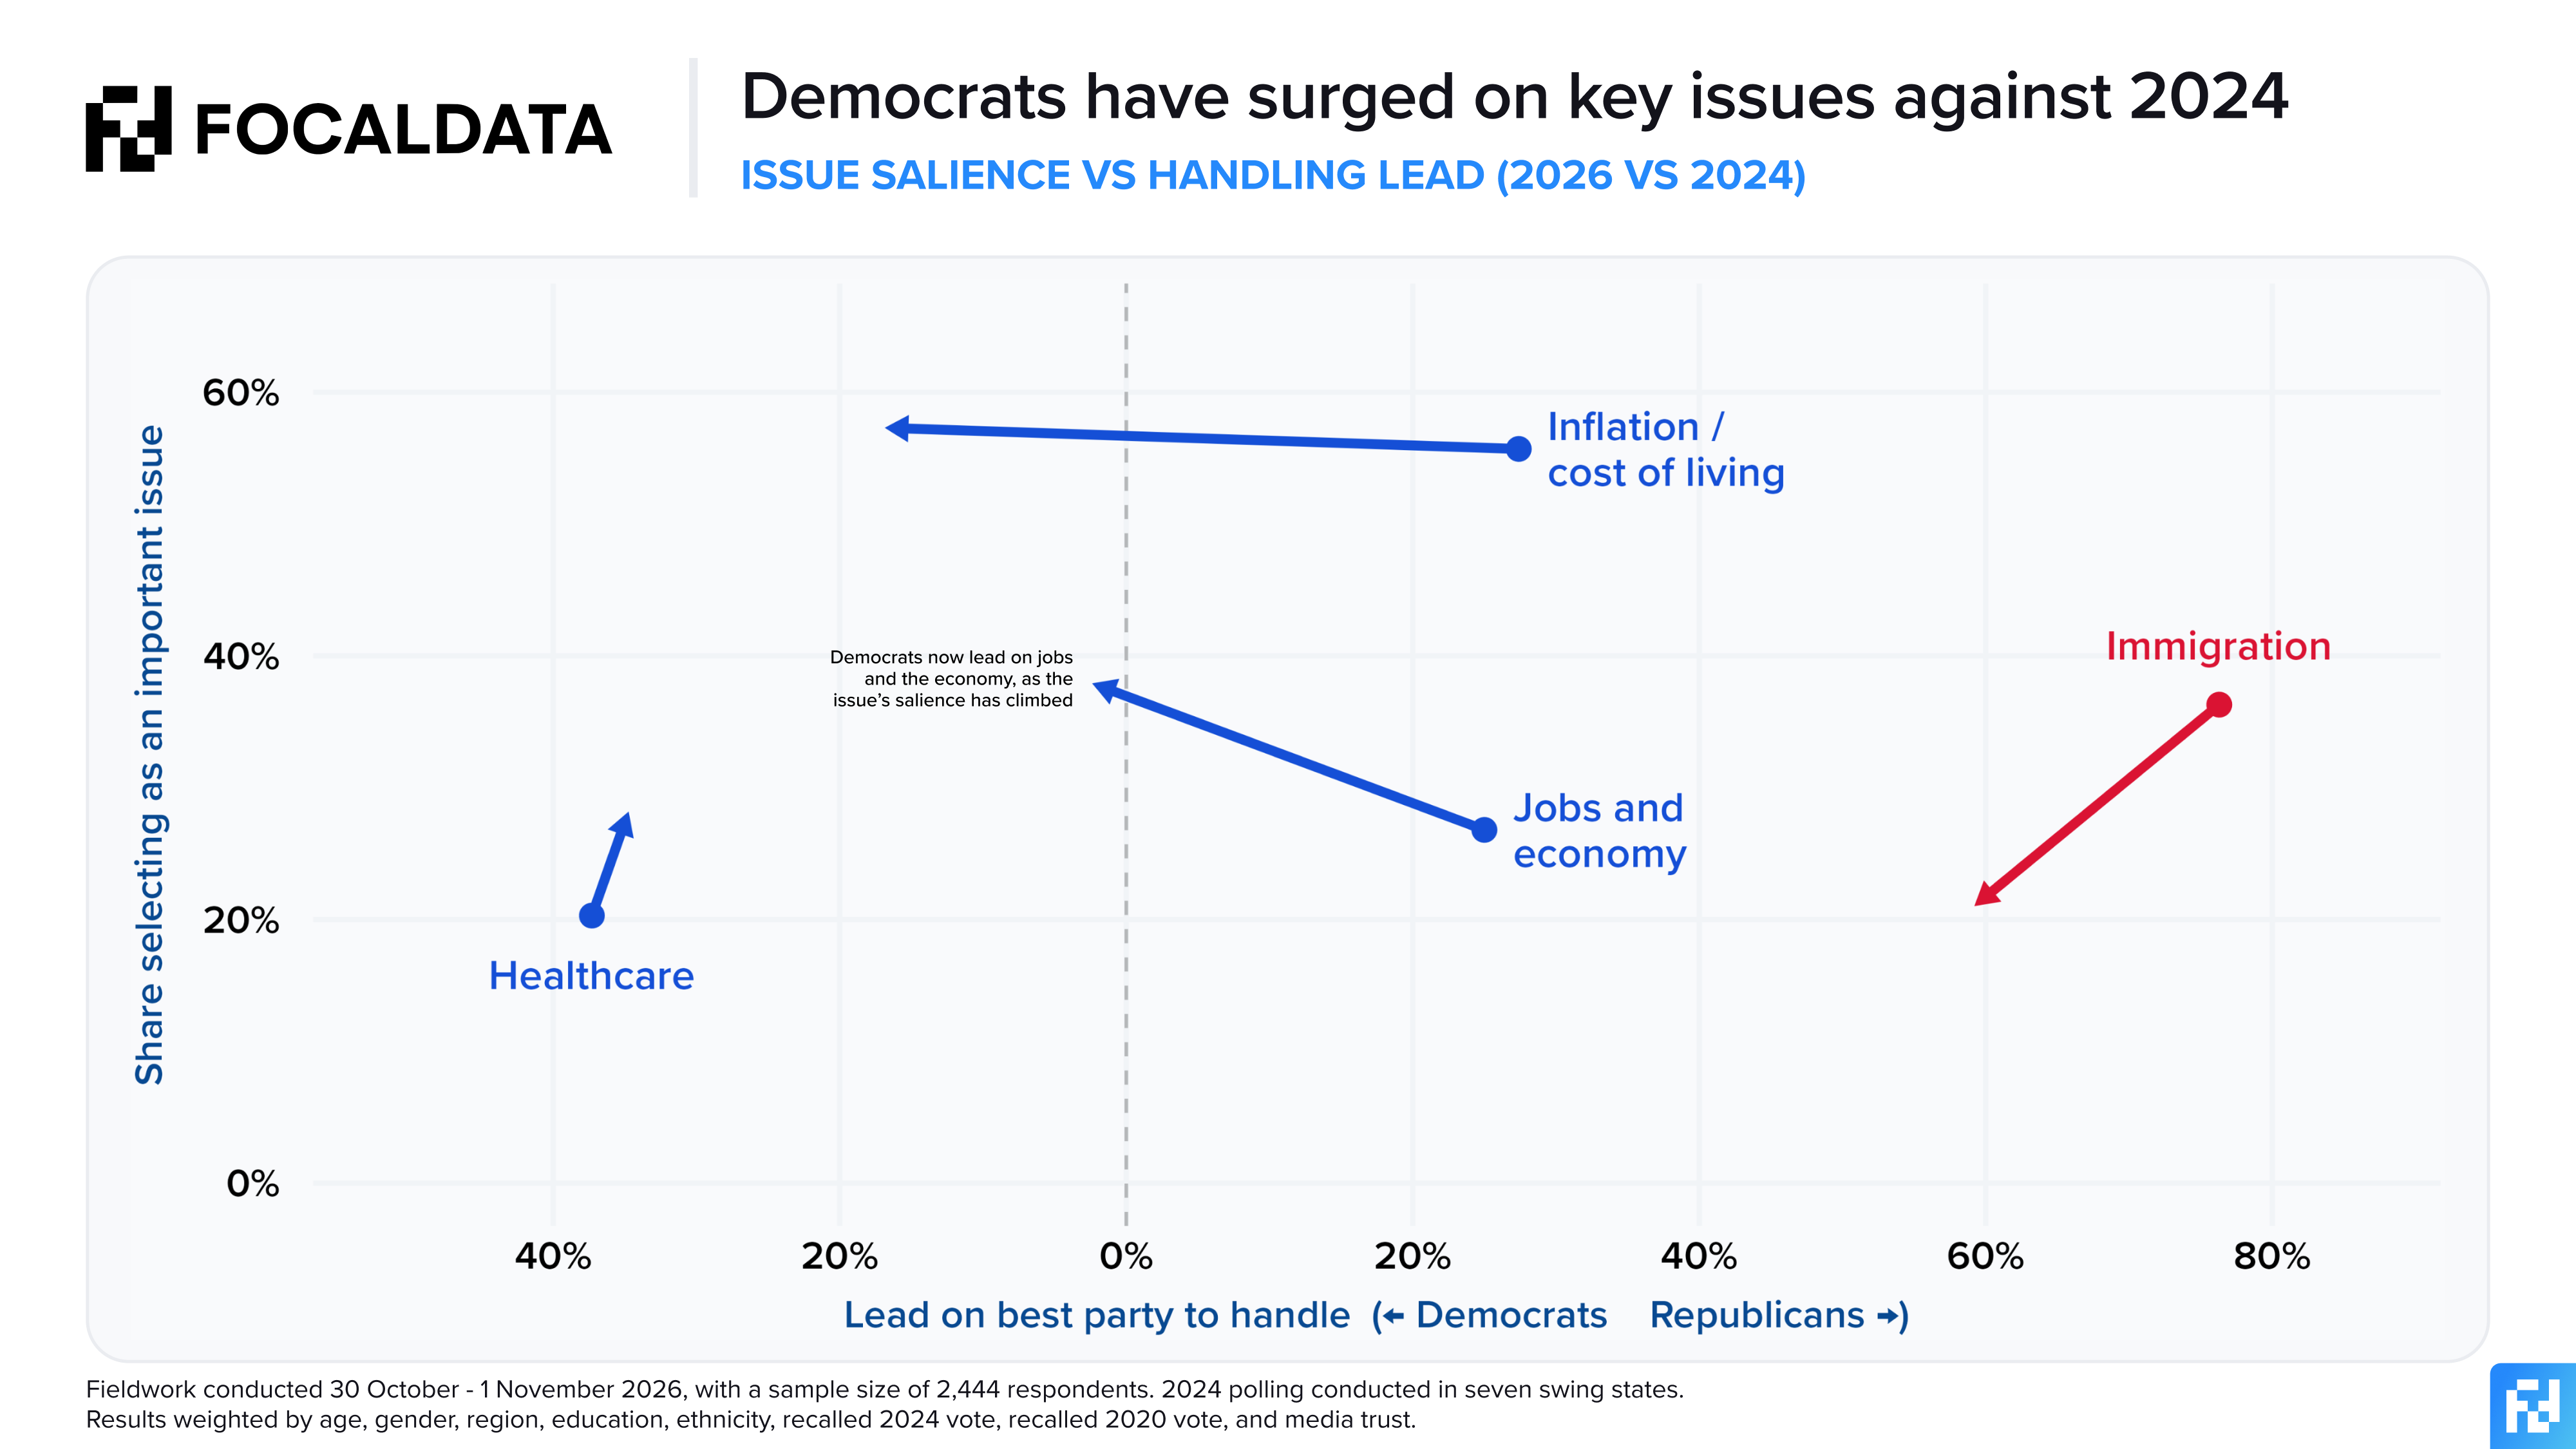
Issues that were the centrepiece of the 2024 elections like inflation and the economy more widely have seen a consistent Democratic advantage in our polls since the beginning of the year.

The Democrats’ weighted issue handling lead stands at a very impressive 13 points, higher than the generic-ballot polls suggest.
This is not just because Democratic issues have become more salient and Republican issues less. The decline in immigration’s salience has certainly helped the Democrats, but the main story of these elections is the huge shift in opinion on the Democrats’ ability to manage economic concerns, with a 44-point shift in perceptions on the best party to handle the cost of living compared to our polling from 2024.
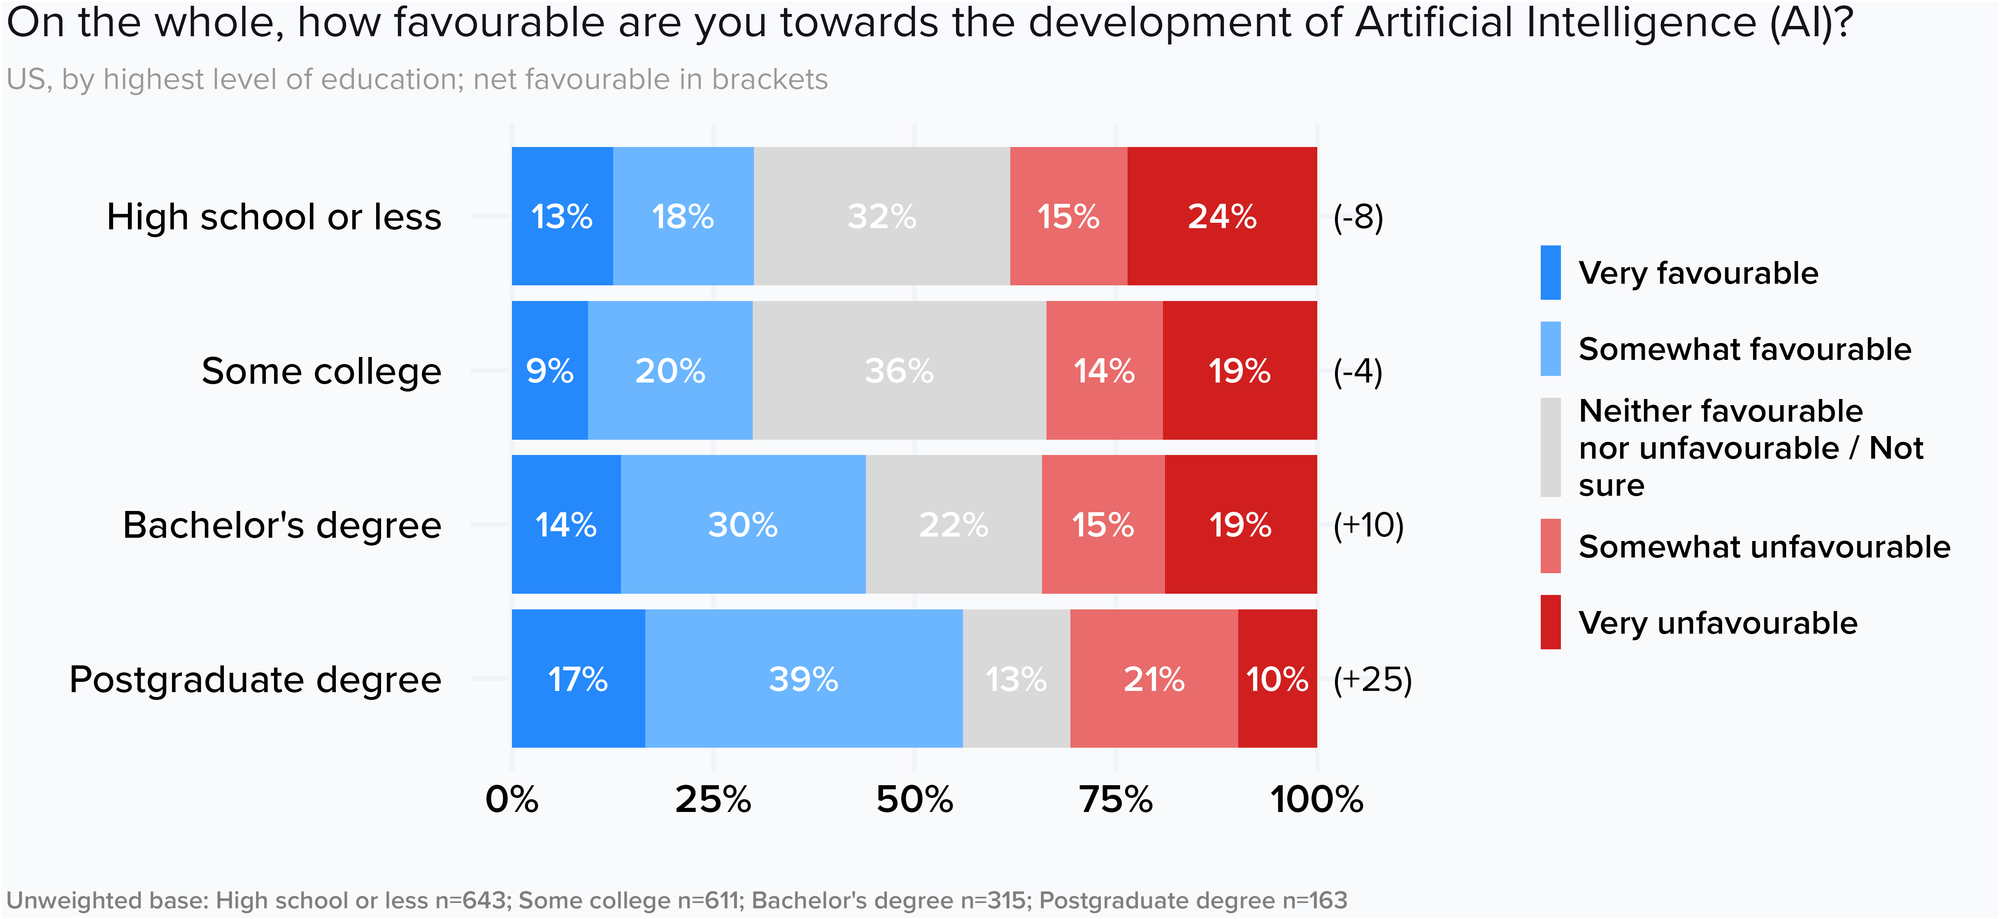
Since the 2024 election, the economic landscape has also changed dramatically. Specifically, with the development of Artificial Intelligence (AI) and related construction of data centres, alongside the war in Iran. These two changes have put pressure on American household finances, and given the American public lower confidence in the Republican party to handle the cost of living.
The existing MAGA coalition relies on two groups that hold opposing viewpoints on tech and AI: lower-educated white voters, and big-tech elites. Where these two groups may unite on cultural issues, they are responding to different pressures around the increasing salience of AI in politics. Concerns around the impact on jobs posed by AI and the construction of data centres in politically contested areas like Ohio give working-class Americans a reason to oppose AI. Whereas, as the Focaldata team wrote about earlier this year for Sam Freedman’s Comment is Freed, the big-tech elites (who have a lot to gain from the further development of AI) contribute significantly to Trump’s Republican party both financially and politically, giving Trump and his party a strong incentive to support its development.
Some elections are more coloured by the AI and data centre debate than others, such as the Ohio and Texas gubernatorial races.

The shift away from the Republicans is bigger than just control of the House and Senate, and more about overall party brands. We asked the American public who they associated with the elites, and the results pointed clearly towards Republicans, a shift from 2024 where the Democrats were the party of the college-educated, higher-income demographic. This realignment comes at a time when high-profile Democrats this cycle (such as Jon Ossoff, Zohran Mamdani, and James Talarico) have increasingly begun talking about affordability and corruption as corner-stones of their campaigns rather than the social pillars associated with the 2024 presidential election.

This shift has also affected Democrats: in April we asked Democrats what they wanted from the Democratic party and a significant portion of them were persuaded by populist messages over moderate / incrementalist ones. This sat in between the mayoral election in New York City that elected Zohran Mamdani, a public member of the NYC branch of the Democratic Socialists of America (DSA), over the candidate backed by establishment Democrats, Andrew Cuomo.
Mamdani has continued to see high favourability ratings in the city. The strength of the left wing of the party was reinforced in New York with the 2026 primary elections, where all three of Mamdani’s endorsed candidates won over their more traditional Democratic counterparts.
Very few seats in the US House of Representatives remain contested (87% of House seats are decided in the primaries), and the number decreases each cycle with continued gerrymandering. Therefore, these candidates that win in the primaries and face little to no opposition in the general election may be a misleading signal about the state of overall Democratic voters. Many are looking towards candidates such as Abdul El-Sayed (despite disputing that he is affiliated with the DSA, he was seen as the progressive in the primary against Mallory McMorrow and Haley Stevens) to see if similar politics can win outside of the Democratic stronghold districts.
In our final forecast, El-Sayed leads Michigan, Talarico leads in Texas, and Ossoff leads in Georgia.
Relative to other Senate candidates, El-Sayed is under-performing expectations by around 3pts. The most progressive candidates in the cycle are all under-performing in our model compared to what our prior expectations would approximately have them as. This isn’t holistically attributable to their ideological position (e.g. is Jackson under-performing by 12pts in Maine or is Collins over-performing by 12pts?), but shows a pattern that people may point to after the election when looking forward to the 2028 Presidential primaries.
What machine learning says
Our BART model, trained on around 30,000 survey responses, shows a swing to the Democrats of around 9 points since 2024 across all voters. The swing is not even. Young, lower-educated voters, and those with incomes under $50,000, are swinging the most: 16 points among 30 to 39 year olds, 16.5 points among those with a high school education or less, and 12 points among those earning under $50,000. The smallest swings are among those aged 70 and over (5 points), college graduates (5 points) and those earning over $150,000 (5.5 points).
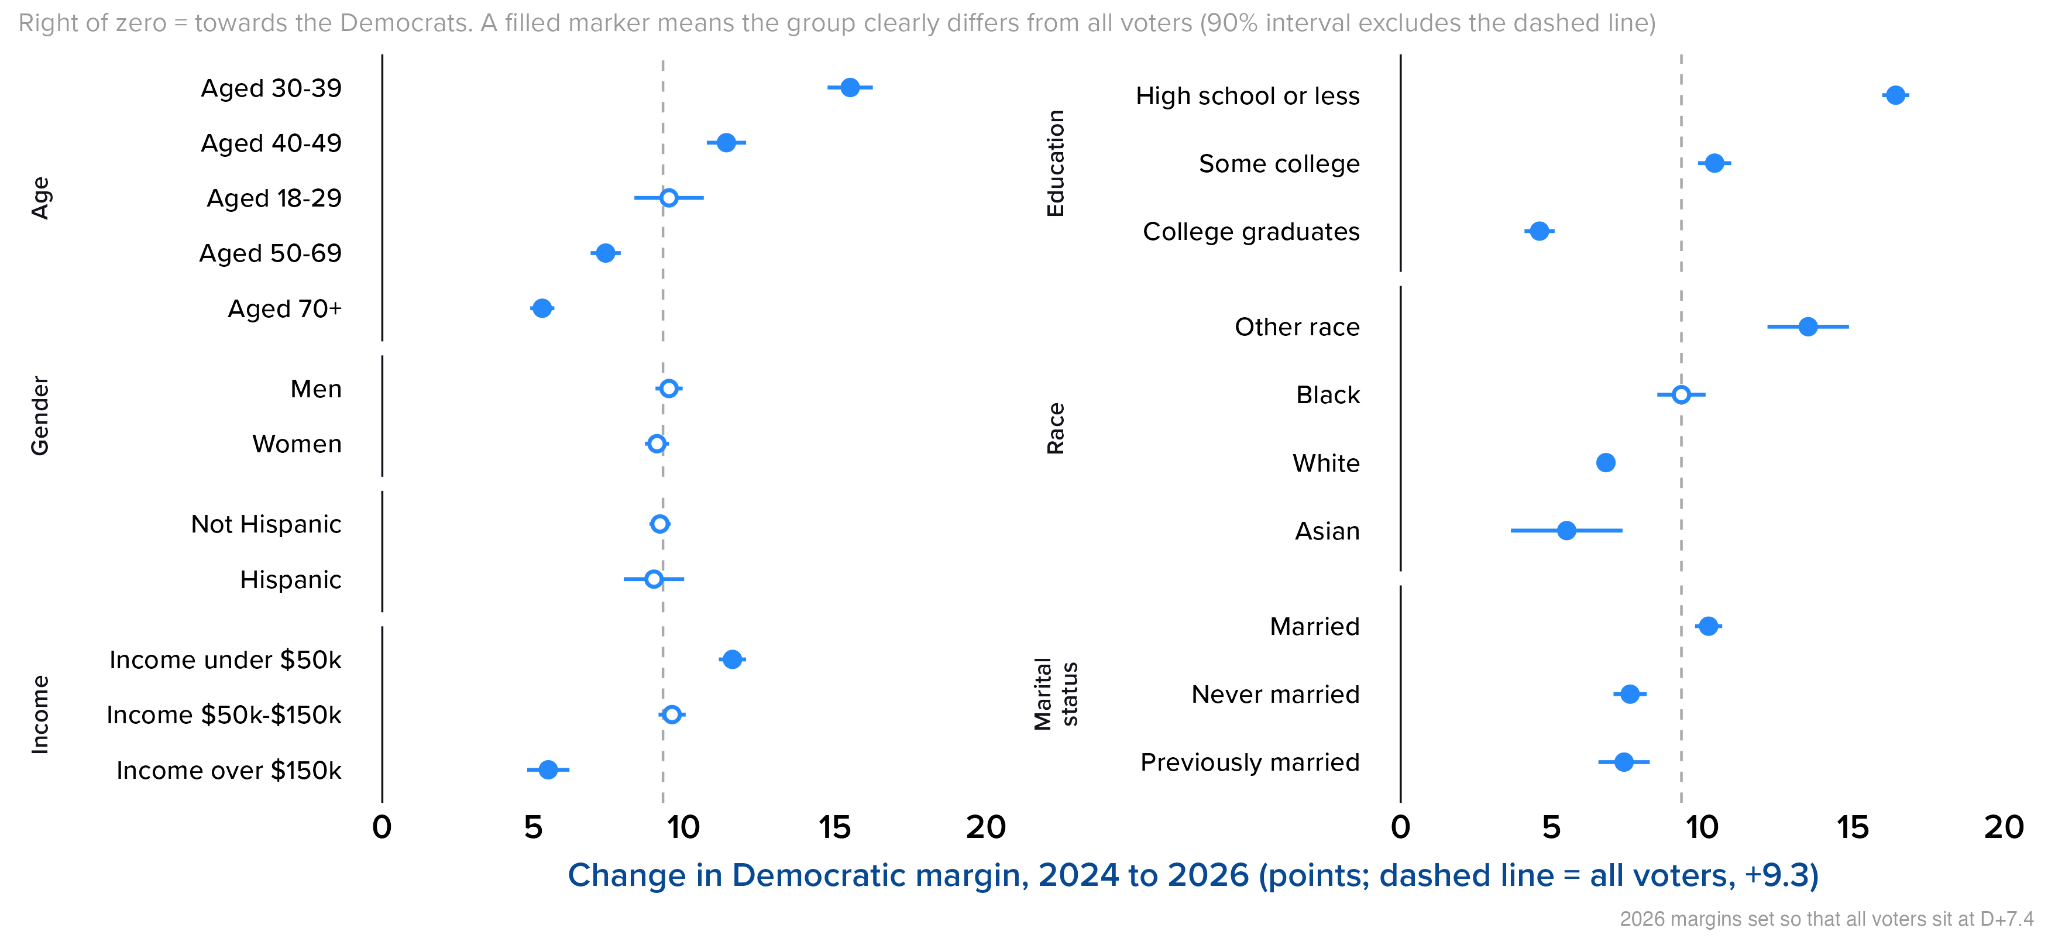
That is the same group of lower-propensity, lower-trust voters that powered Trump’s turnout advantage in 2024. Across the House map, the biggest expected swings are in districts with lots of these voters, such as South Texas.
What the pundits are talking about
As covered above, polling misses still correlate with low-interest voter gaps. The midterms electorate being more engaged than a presidential one goes some way to explaining why midterms polling has traditionally been more accurate, as many low-trust and low-interest voters simply stay at home on election day. The average polling bias is -0.9 points in midterm years, against -1.7 in presidential years. But the polls still missed towards Republicans in 2014 and 2022, so we cannot simply assume the problem goes away in a midterm election.
In 20 of the past 22 midterm elections (since 1936) the President’s party loses seats in the US House of Representatives. To estimate the scale of that loss, we can look at a few metrics we call ‘fundamentals’ such as presidential job approval and party trust on key issues. The unhappier people are with who they determine to be the governing party, the stronger gains will be for the opposition party.
There are a few data points that pundits are pointing to, to explain this year’s election.
- “Trump on the ballot”. The argument goes that in a highly-polarised political environment, the election outcomes are largely driven by differential turnout. That is, who can turn out new voters that don’t have a voting record, to offset the base of the other party’s loyal voters. In 2024 that answer was overwhelmingly Trump. Trump was able to turn out new voters across the country, with gains highest among Hispanic voters (Pew). However, without the belief that voters are voting for Trump, can Republicans maintain this turnout advantage?

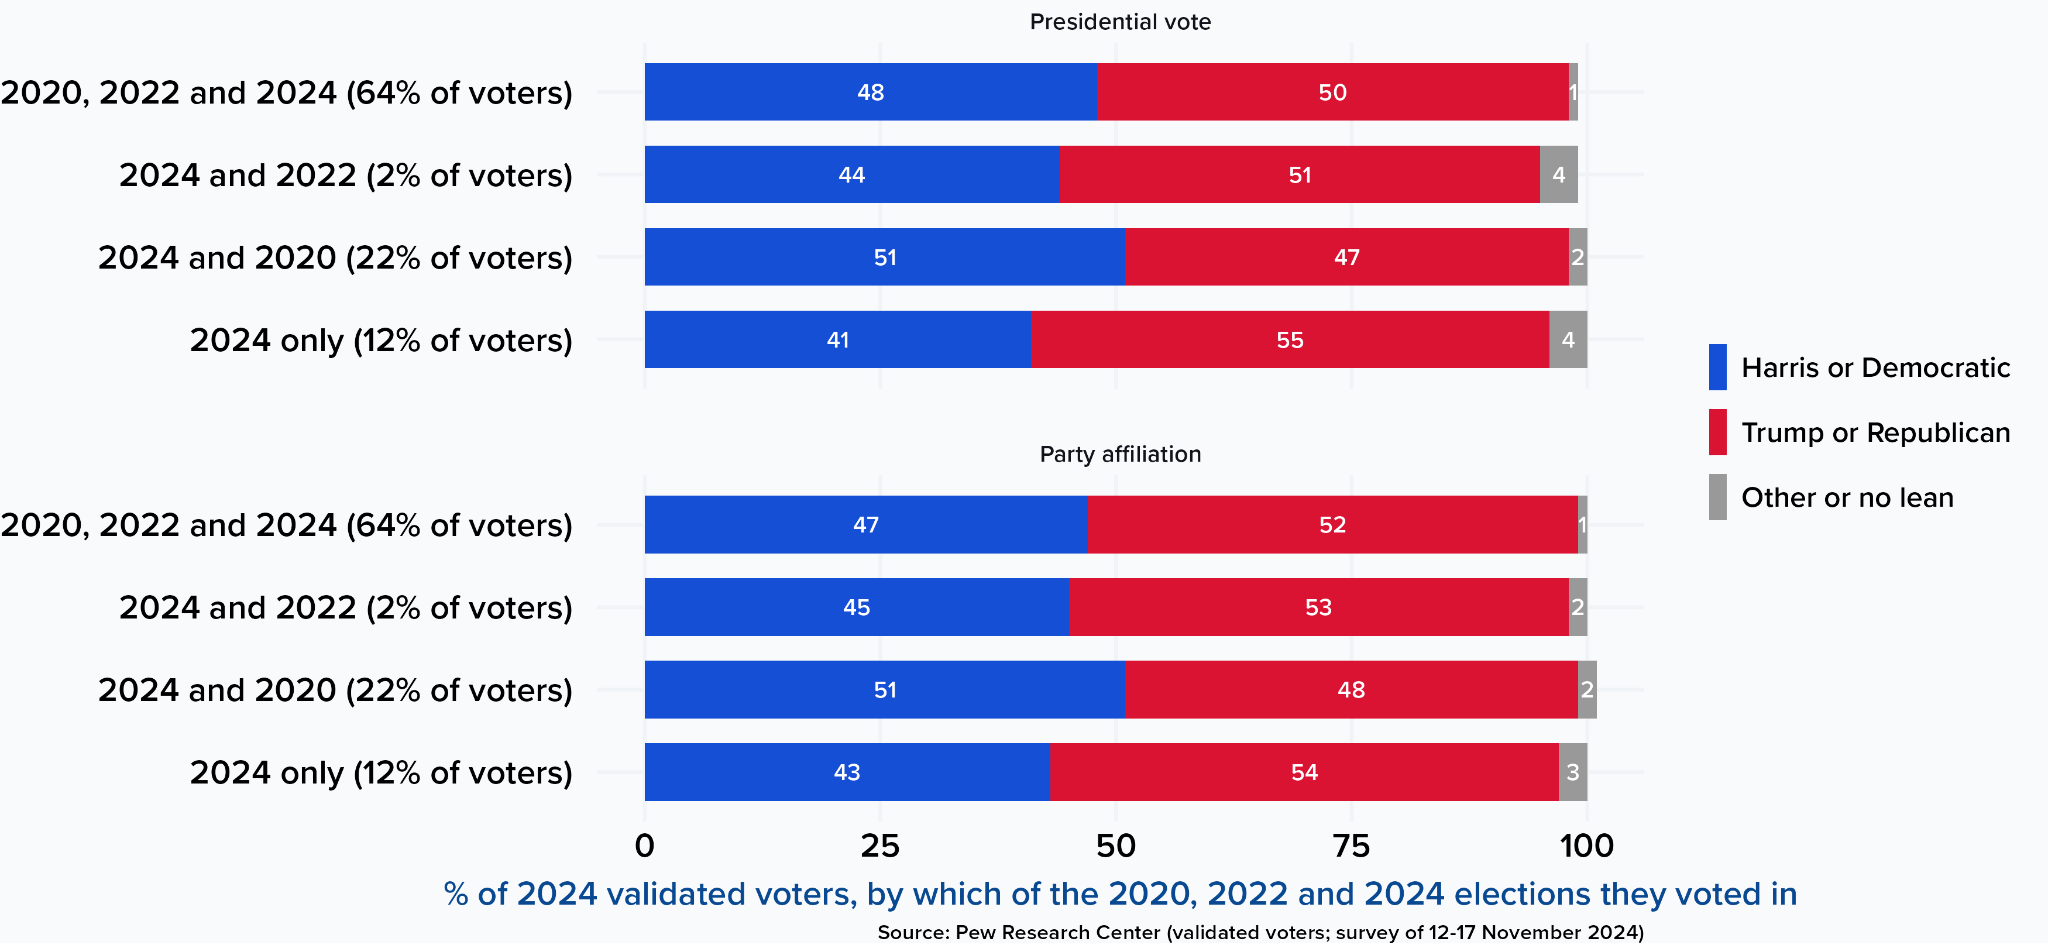
- Fewer people vote in the midterms. Turnout is consistently lower in midterm years than in presidential elections. Because of this, the electorate is typically composed of those who are more likely to vote to begin with. Trump’s presidential victories have been bolstered by a turnout advantage among those who are considered “low-information voters” or “low-propensity voters”. In a midterm election year, despite being the centre of many polling misses (see: non-ignorable non-response bias), there are fewer of them that will actually vote on, or before, election day. This means that the electorate is likely to be older, whiter, and more educated than it would be in a presidential election year, overlapping with people who are more engaged and likely to respond to surveys. As a result, the average of all polls has been within 1pt of the actual outcome in both 2022 and 2018 (compared to 2-5pts in Presidential years). (Source: AAPOR)
- The midterm electorate is historically disproportionately white, highly educated, and higher-income; typically associated with more highly engaged voters compared to the lower-trust, lower-propensity voters that are emblematic of the Trump coalition.
- How people feel about the president matters. Historically there is a correlation between how many seats the president’s party has to begin with, and metrics like presidential job approval and leader favourability. On these metrics, Republicans face an uphill battle: Trump’s favourability has seen a near-constant decrease since we began tracking in January. Earlier in this report, we looked at some reasons why we have seen these decreases and what that means we can expect on election day.

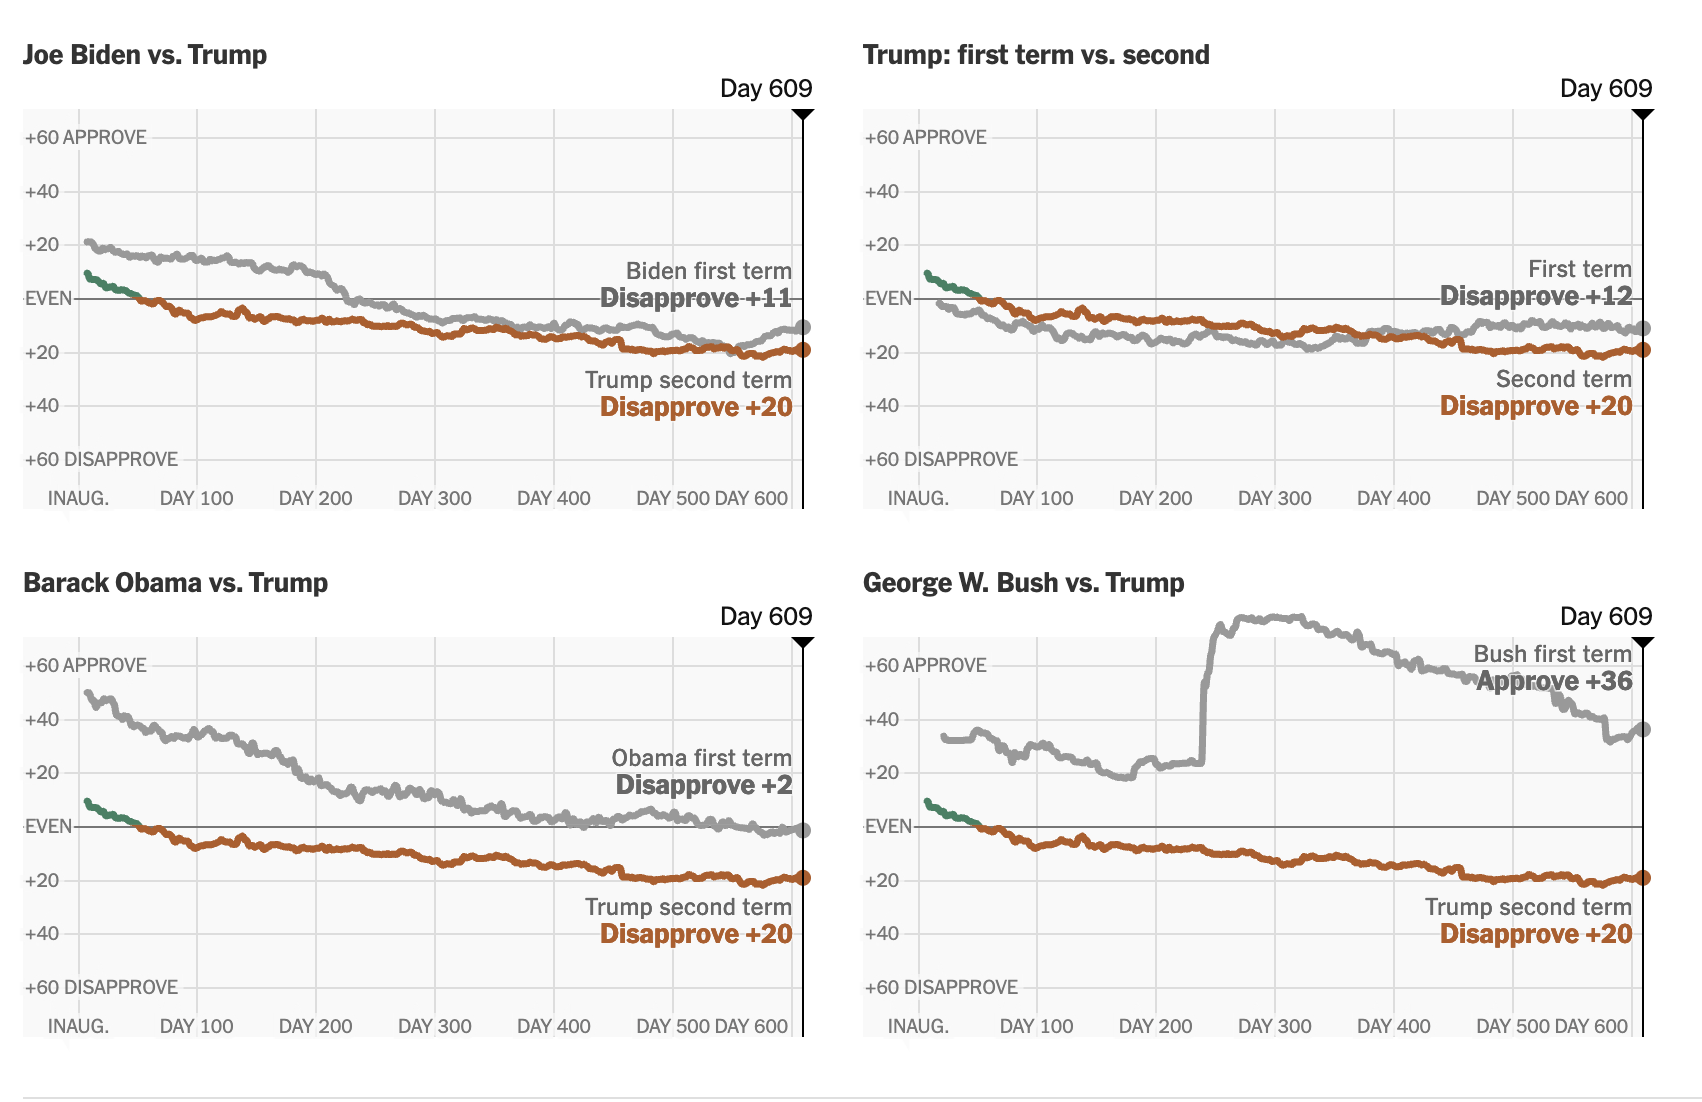
Source: New York Times (20 September 2026).
How the model works
Throughout 2026, we have been running monthly surveys in conjunction with the Financial Times, gathering the views of around 30,000 Americans in the process. We have produced an election forecasting model which relies upon that large sample, alongside a combination of public polling and fundamentals analysis. We are a data company (it is in our name), and would not have the temerity to suggest only our data is useful. Different data points and data sources can provide insights the other cannot. Public polling helps provide extra coverage in certain states where national polling may achieve little coverage, and fundamentals can help us understand the likely state of the race in various House elections nobody has polled. Likewise, MRP and other machine-learning methods trained on a large proprietary dataset give us crucial data on demographically-driven changes in voting behaviour which public forecasters do not have access to. Our backtesting on previous elections indicates that public polling, fundamentals and models trained on our own data all improve forecasting accuracy.
Our model combines a variety of data sources to come up with our best estimate for the state of every race in the Senate and House of Representatives, and each party’s chance of winning control of each chamber. For every race, the model combines three sources of data:
- Non-polling priors (what we would expect from each seat’s history and candidates)
- Our own BART modelling on the c. 30,000 responses we have collected over 2026
- Public polling (both the generic ballot average and polls in individual races)
Public polling
We collect all the polls that have been conducted in each race, and of the generic ballot, from a variety of sources including VoteHub, Wikipedia, and RealClearPolling. We produce polling averages for every polled race, accounting for each pollster’s partisan lean, whether polls were sponsored by a particular party or campaign, and how much the national picture has shifted since each poll was carried out.
Our averages give more weight to newer polls, those with larger sample sizes, and pollsters with a better track record of accuracy.
The model also allows for polls in some districts to adjust our expectations for similar unpolled districts. A big swing to the Democrats in a Texas House seat with a lot of Hispanic voters without degrees would also inform our expectations for a neighbouring seat with a similar demographic makeup.
We also account for undecided voters in each poll. Instead of simply rebasing the vote shares of the ‘decideds’, we assign undecided voters somewhere in the middle of a proportional and uniform split between the main candidates.
We adjust all public polls according to expected non-ignorable non-response bias, as covered below.
Our own data
Through surveys we have conducted between January and November, we have data on around 30,000 Americans and their views on both the House and Senate races in their area.
We analyse these survey responses using a method similar to MRP known as BART (Bayesian Additive Regression Trees). BART is trained on respondents’ individual demographics, race-level factors and area-level characteristics. It estimates how each type of voter will vote and combines those votes in each seat.
MRP often performs well when it comes to accurately modelling the views of hard-to-reach respondents, allowing us to partially pool similar respondents across different areas. However, it also has a tendency to pull responses to the mean to form a more normal looking curve, which often misses those at the tails. A more complex model that incorporates machine-learning techniques, such as tree-based models, can help capture non-linear patterns. BART combines Bayesian statistics with machine-learning tree-based models: each tree asks a few questions about a respondent, and adds or subtracts a little from their Democratic score. Like MRP, it gives us confidence intervals for every seat, and from those, the number of seats each party wins.
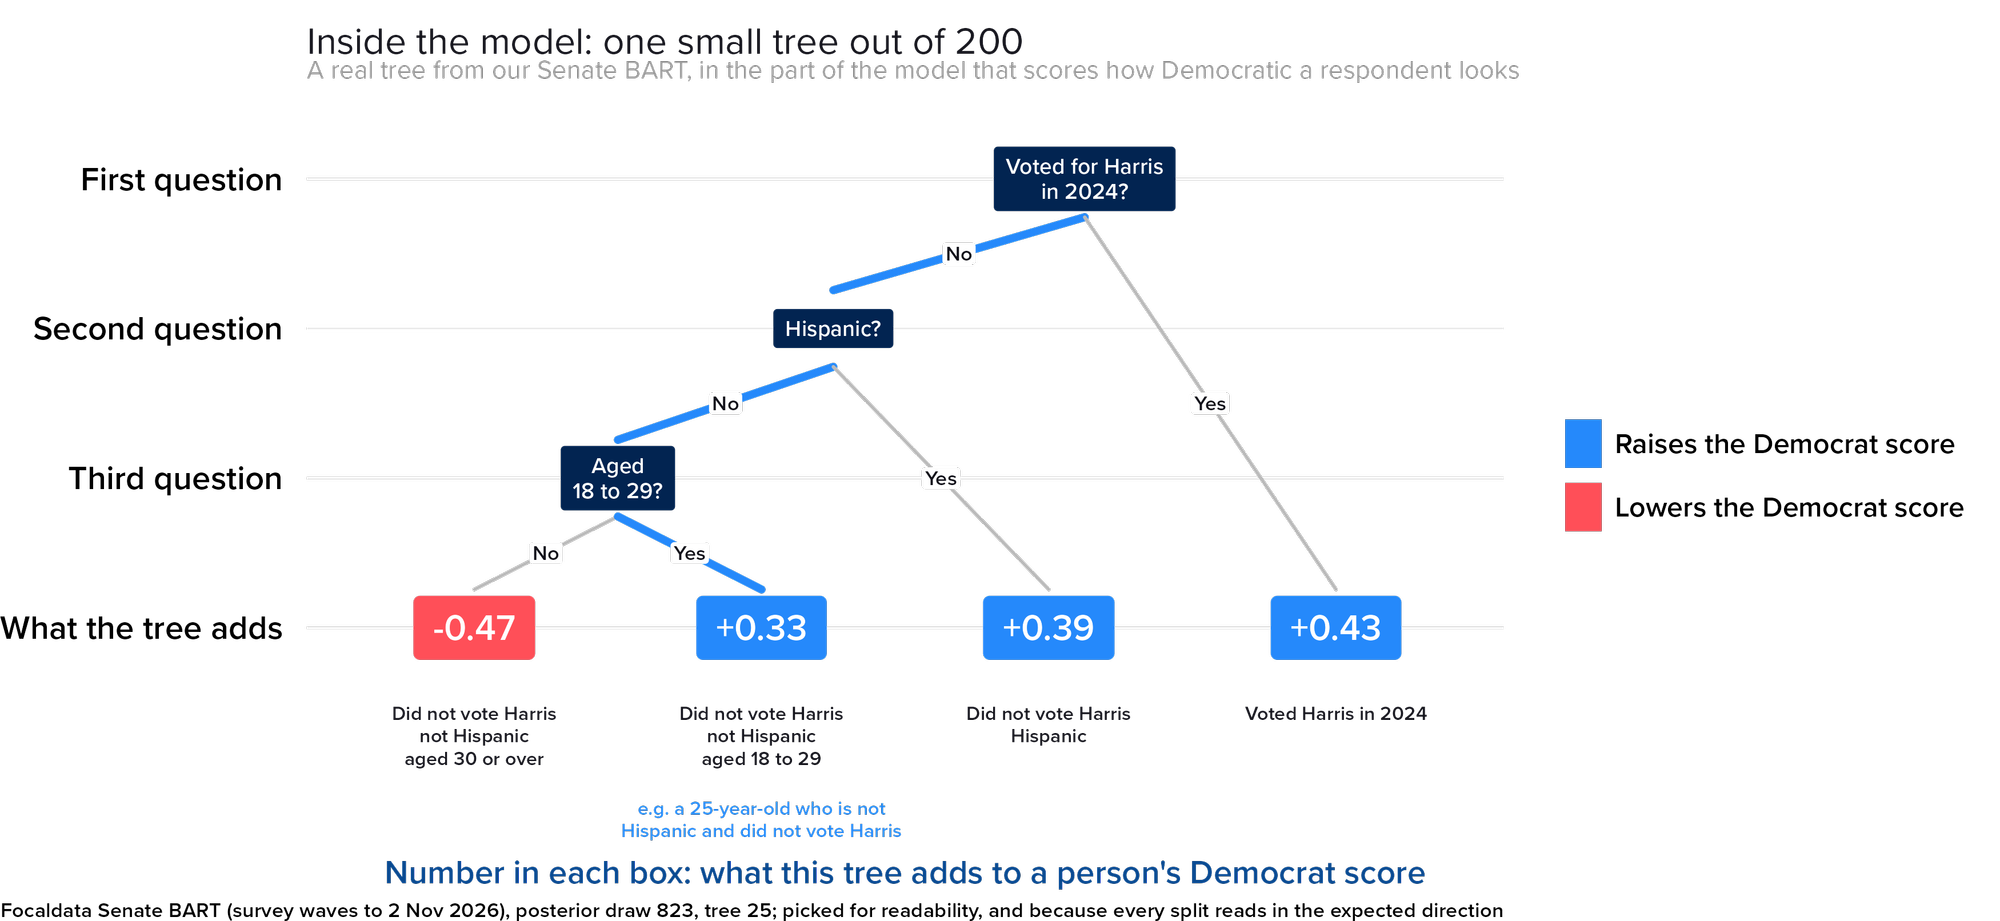
We match our survey estimates to the national environment: they are shifted so their average across races matches the generic ballot, then by the same adjustment for expected polling error as the rest of the forecast. That way, our own data tells us where each race sits relative to the others, rather than setting the national level on its own.
Beyond the polling
We also incorporate non-polling data on each race from a variety of sources. These include each seat’s partisan lean from previous presidential results, expert ratings, whether the incumbent is standing and their historic performance, and fundraising figures for each candidate.
Each source is weighted based on how accurate it has been in previous elections, and varies depending on how confident we are on each estimate in each race.
Swings in the model are non-linear. Seats that lean towards the party losing ground tend to swing more. This makes sense, with the challenger party targeting swing seats and putting fewer resources into safe ones. In a 10-point swing to the Democrats, the highest swings are typically seen in R+15 to R+20 seats.
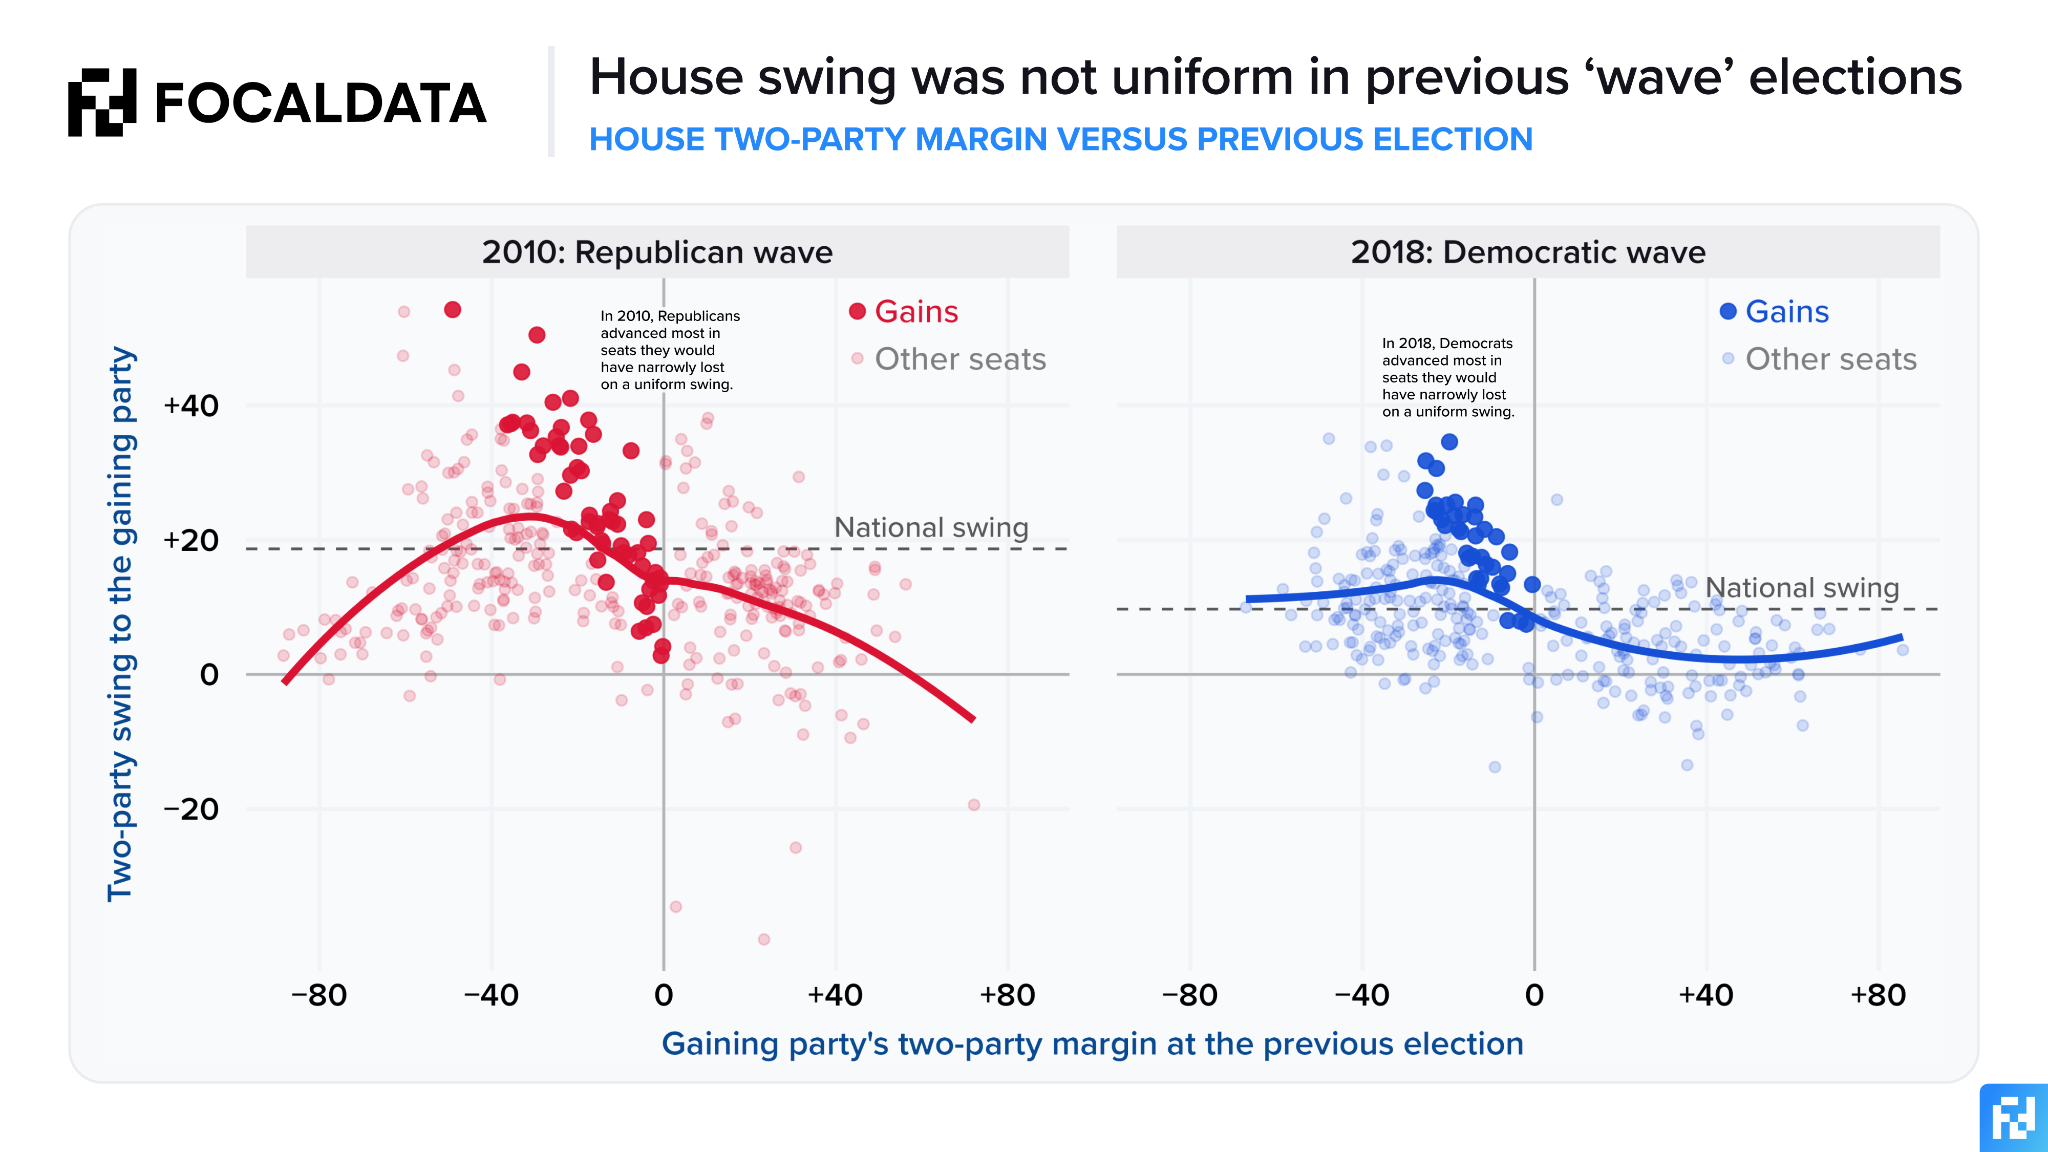
The model has been backtested on every 2-year election cycle since 2008, using pre-election polling from the CES to stand in as a proxy for our own survey data.