Blog/Analysis
AI is Passing Your Quality Checks. Now What?
Last month, Bible Society was informed that they could no longer trust the results of ‘The Quiet Revival’, based on data collected in 2024 which has now been deemed faulty. In 2023, a US government-funded survey of beekeepers received over 2,500 responses – after quality screening, only 4% were legitimate – the rest were bot-generated.
These are just two examples, but if your research informs product launches, brand strategy, policy decisions, or investment, this isn’t merely an academic problem, it’s a commercial one. If your quality checks haven’t evolved for AI, your data is almost certainly compromised.
Legacy quality measures tend to focus on catching inattentive or low-effort respondents (things like gibberish verbatims or clearly inconsistent answers). These are no longer adequate. AI-powered bots and AI-assisted fraudsters have been increasingly capable of passing legacy quality checks and impersonating human responses.
The Scale of the Problem
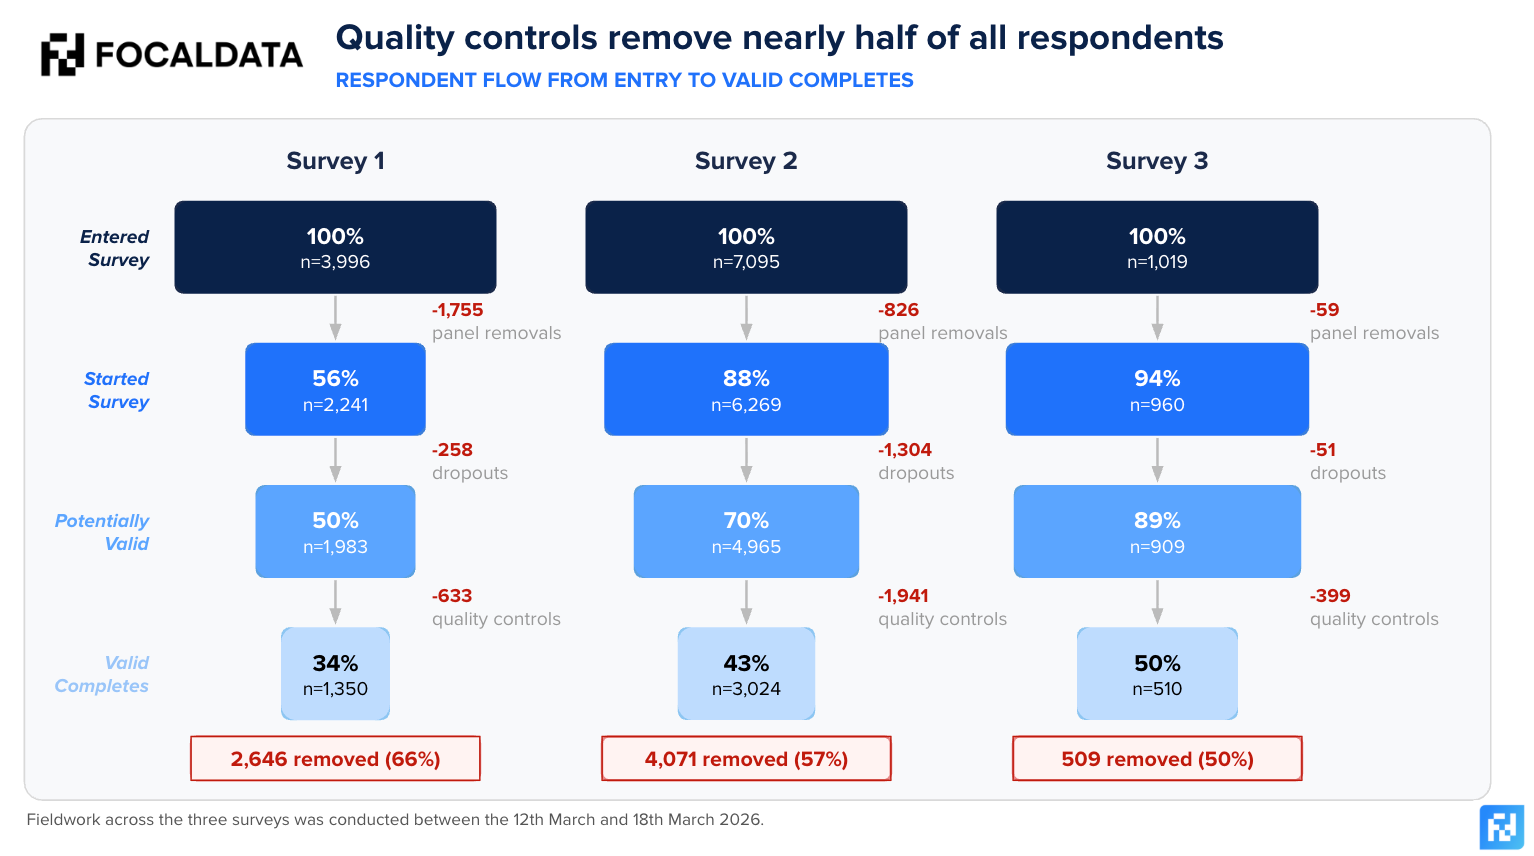
To demonstrate how data quality really works, we’ve taken three recent studies and analysed where and why bad respondents are removed in the process. Across these studies, over 12,000 respondents entered our surveys, but only 40% survived to final delivery. The rest were removed – by panel-level checks, drop-outs, or by our own quality filters.
Focaldata works directly with a panel aggregator, plugging in via API to more than 120 markets globally, with access to over 3.5 million respondents. On average, we remove 35-40% of respondents who enter our system on data quality grounds (after panel cleaning). This is a much more robust action than the industry average of around 10%. If your research provider is only removing 10% of panel respondents, the question likely isn’t whether there is bad data in your results, but how much.
The attrition happens at three stages: panel-level removal before the survey starts, survey drop-out midway through, and our own quality checks on completers. This last stage is the one worth paying most attention to – these are respondents who completed the survey and would have been delivered to a client without further intervention. The chart below shows part of our funnel of removals across three recent surveys. We conduct additional checks on top of those listed below, but we have chosen not to publish these and effectively give the answers of a test to those who might be trying to cheat on it!
- Survey 1: Impossible Answer Check. Are respondents giving inconsistent answers across questions, or saying they can do things which fewer than one in a million people can actually do (e.g. possessing extremely high levels of expertise or knowledge in a niche field).
- Survey 2: Attentiveness Check e.g., quiz respondents on information presented to them during a survey.
- Survey 3: AI-removals Check e.g., include questions specifically designed to spot AI generated responses.
What Drives Removals
We apply standard checks to every survey: flatliner detection, inconsistent answers, demographic and panel consistency, location verification, speeder flags, and manual review. On top of these, this blog explores the additional checks we implement as informed by our data quality working group to spot the most effective methods. This layered approach is what separates robust quality systems from superficial ones. The chart below represents the primary removal reason per survey for each removed respondent who would have otherwise been considered as a valid response.
Each removed respondent in the chart below is attributed to the first check that flagged them. Because checks run in layers — standard checks first, then the survey-specific check — the additional check's removal rate reflects only those respondents who passed every standard check. This makes the survey-specific findings particularly striking: these are respondents that standard quality methods would have let through.
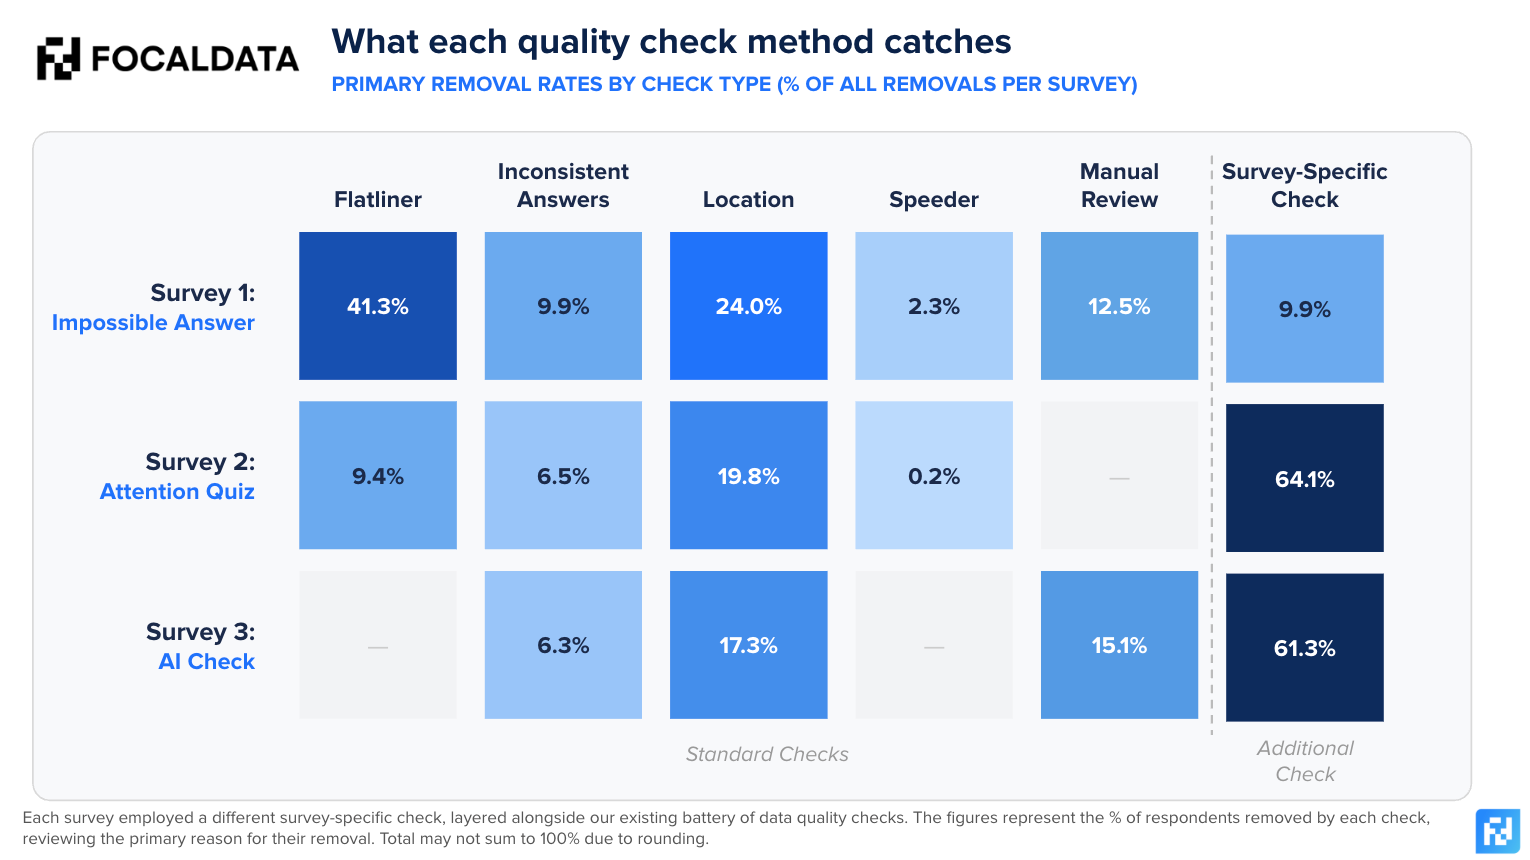
The standard checks consistently catch a significant share of poor-quality responses, but the survey-specific checks reveal the scale of what standard methods miss. If you need to ensure complete respondent attention, including a quiz alone (Survey 2) can remove almost two thirds of respondents. Survey 3’s AI-specific test is potentially the most interesting – catching 60% of respondents. These aren’t speeders, or low-effort respondents – these are completions that look genuine, but in reality are bogus.
Think you can spot an AI-generated response? Put it to the test.
The harder problem is what the standard checks don’t catch. Advanced AI-generated data doesn’t fail basic attention checks, and doesn’t contradict itself between questions. The characteristics of previously “good” and attentive respondents are now the easiest for AI to replicate. Treating the absence of red flags as sufficient absence of quality risks retaining polished, confident-sounding responses which are entirely synthetic.
Conversely, signals which may flag low-quality responses do not always cleanly map onto inattentiveness or fraud. A short open-ended answer is not necessarily a bad one; a fast completion time may reflect genuine familiarity with a topic; inconsistent grammar or poor linguistic fluency may be a non-native speaker providing an honest response. Applying indications in isolation risks removing real voices while leaving more sophisticated AI-generated responses untouched.
Who Gets Removed
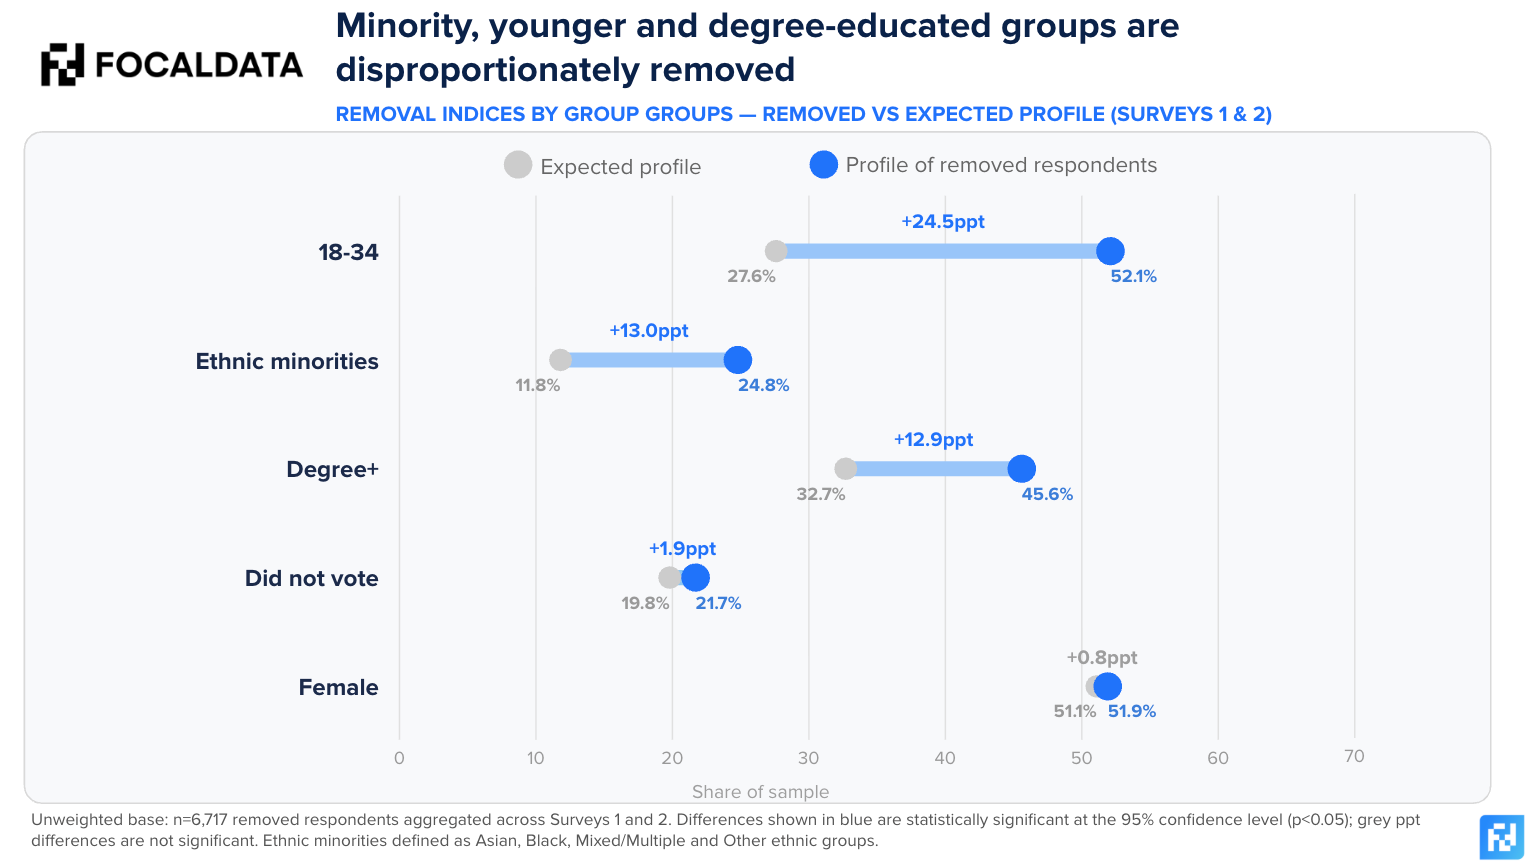
When we compare the profile of removed respondents against the desired sample of a UK Nat Rep survey – they are not demographically neutral. Younger respondents and degree-educated individuals are significantly overrepresented among those flagged by quality checks. This may reflect greater exposure to AI tools, or behaviours that more closely resemble AI-generated responses.
More notably, we see higher removal rates among some minority groups, which raises an important question about the economics of online survey fraud. On the one hand, it may indicate that the signals used in quality checks disproportionately flag certain types of genuine respondents. Another (more likely) possibility is that these groups are more actively targeted by fraudulent actors. Hard-to-reach demographics typically command higher incentive rates, making them more attractive targets for those seeking to maximise returns. They are also harder to recruit – so the supply of genuine respondents is depleted more quickly, leaving room for AI-generated responses to fill the gap.
Ensuring accuracy must not come at the expense of representation. This means taking a nuanced and considered approach to data quality removals, and look at the pattern across multiple signals to determine if a respondent is low-attention, or potentially fraudulent, rather than relying on any single quality check as gospel.
What You Should Be Asking Your Research Provider
Whether you commission research directly or through an agency, these are the questions that matter:
- What percentage of respondents do you remove, and at what stage? If it’s under 20%, ask why. The gap between 10% and 35% is the difference between legacy quality checks, and a system built for today’s threat landscape.
- What types of data quality checks do you run? A single attention check is not a quality system. Look for layered approaches: demographic consistency, AI-testing, manual review.
- What are you doing to combat the proliferation of AI? AI detection tests, response pattern analysis and adaptive methodologies are the minimum. If your provider isn’t testing for AI, they’re not catching it.
- How do you monitor the demographic impact of removals? Quality checks that disproportionately remove certain groups can distort your sample just as badly as including fraudulent responses.
- Can you provide transparency on quality metrics per project? Your provider should know the removal rate, and breakdown by reason for every study.
To help you evaluate these questions systematically, we’ve created a free AI Data Quality Evaluation Scorecard – a structured tool for benchmarking your provider’s approach against best practice. It covers detection capabilities, transparency, demographic monitoring & more.
The Future of Data Quality
Online surveys remain viable, but only for providers willing to move beyond legacy checks, and invest in adaptive systems. The working assumption must be that AI is present, not that fraud is rare. At the panel and aggregator level, there should be robust upstream identity verification, rigorous CAPTCHA and reCAPTCHA protocols, and biometric or device-based identity checks, to list but a few requirements.
The quiet proliferation of AI-generated responses is not just a data quality issue. It is a question of whether the insights that organisations rely on to make strategic decisions are grounded in reality. At Focaldata, our data quality working group continuously develops and tests new detection methods, monitoring their impact and adjusting accordingly. If you’d like to discuss how we can protect the quality of your research programme, get in touch.